“1%” market board
Market data engineered like a product: a dozen live charts streamed through a Web Worker, with drawings, price alerts and an impulse monitor that notifies but never trades.
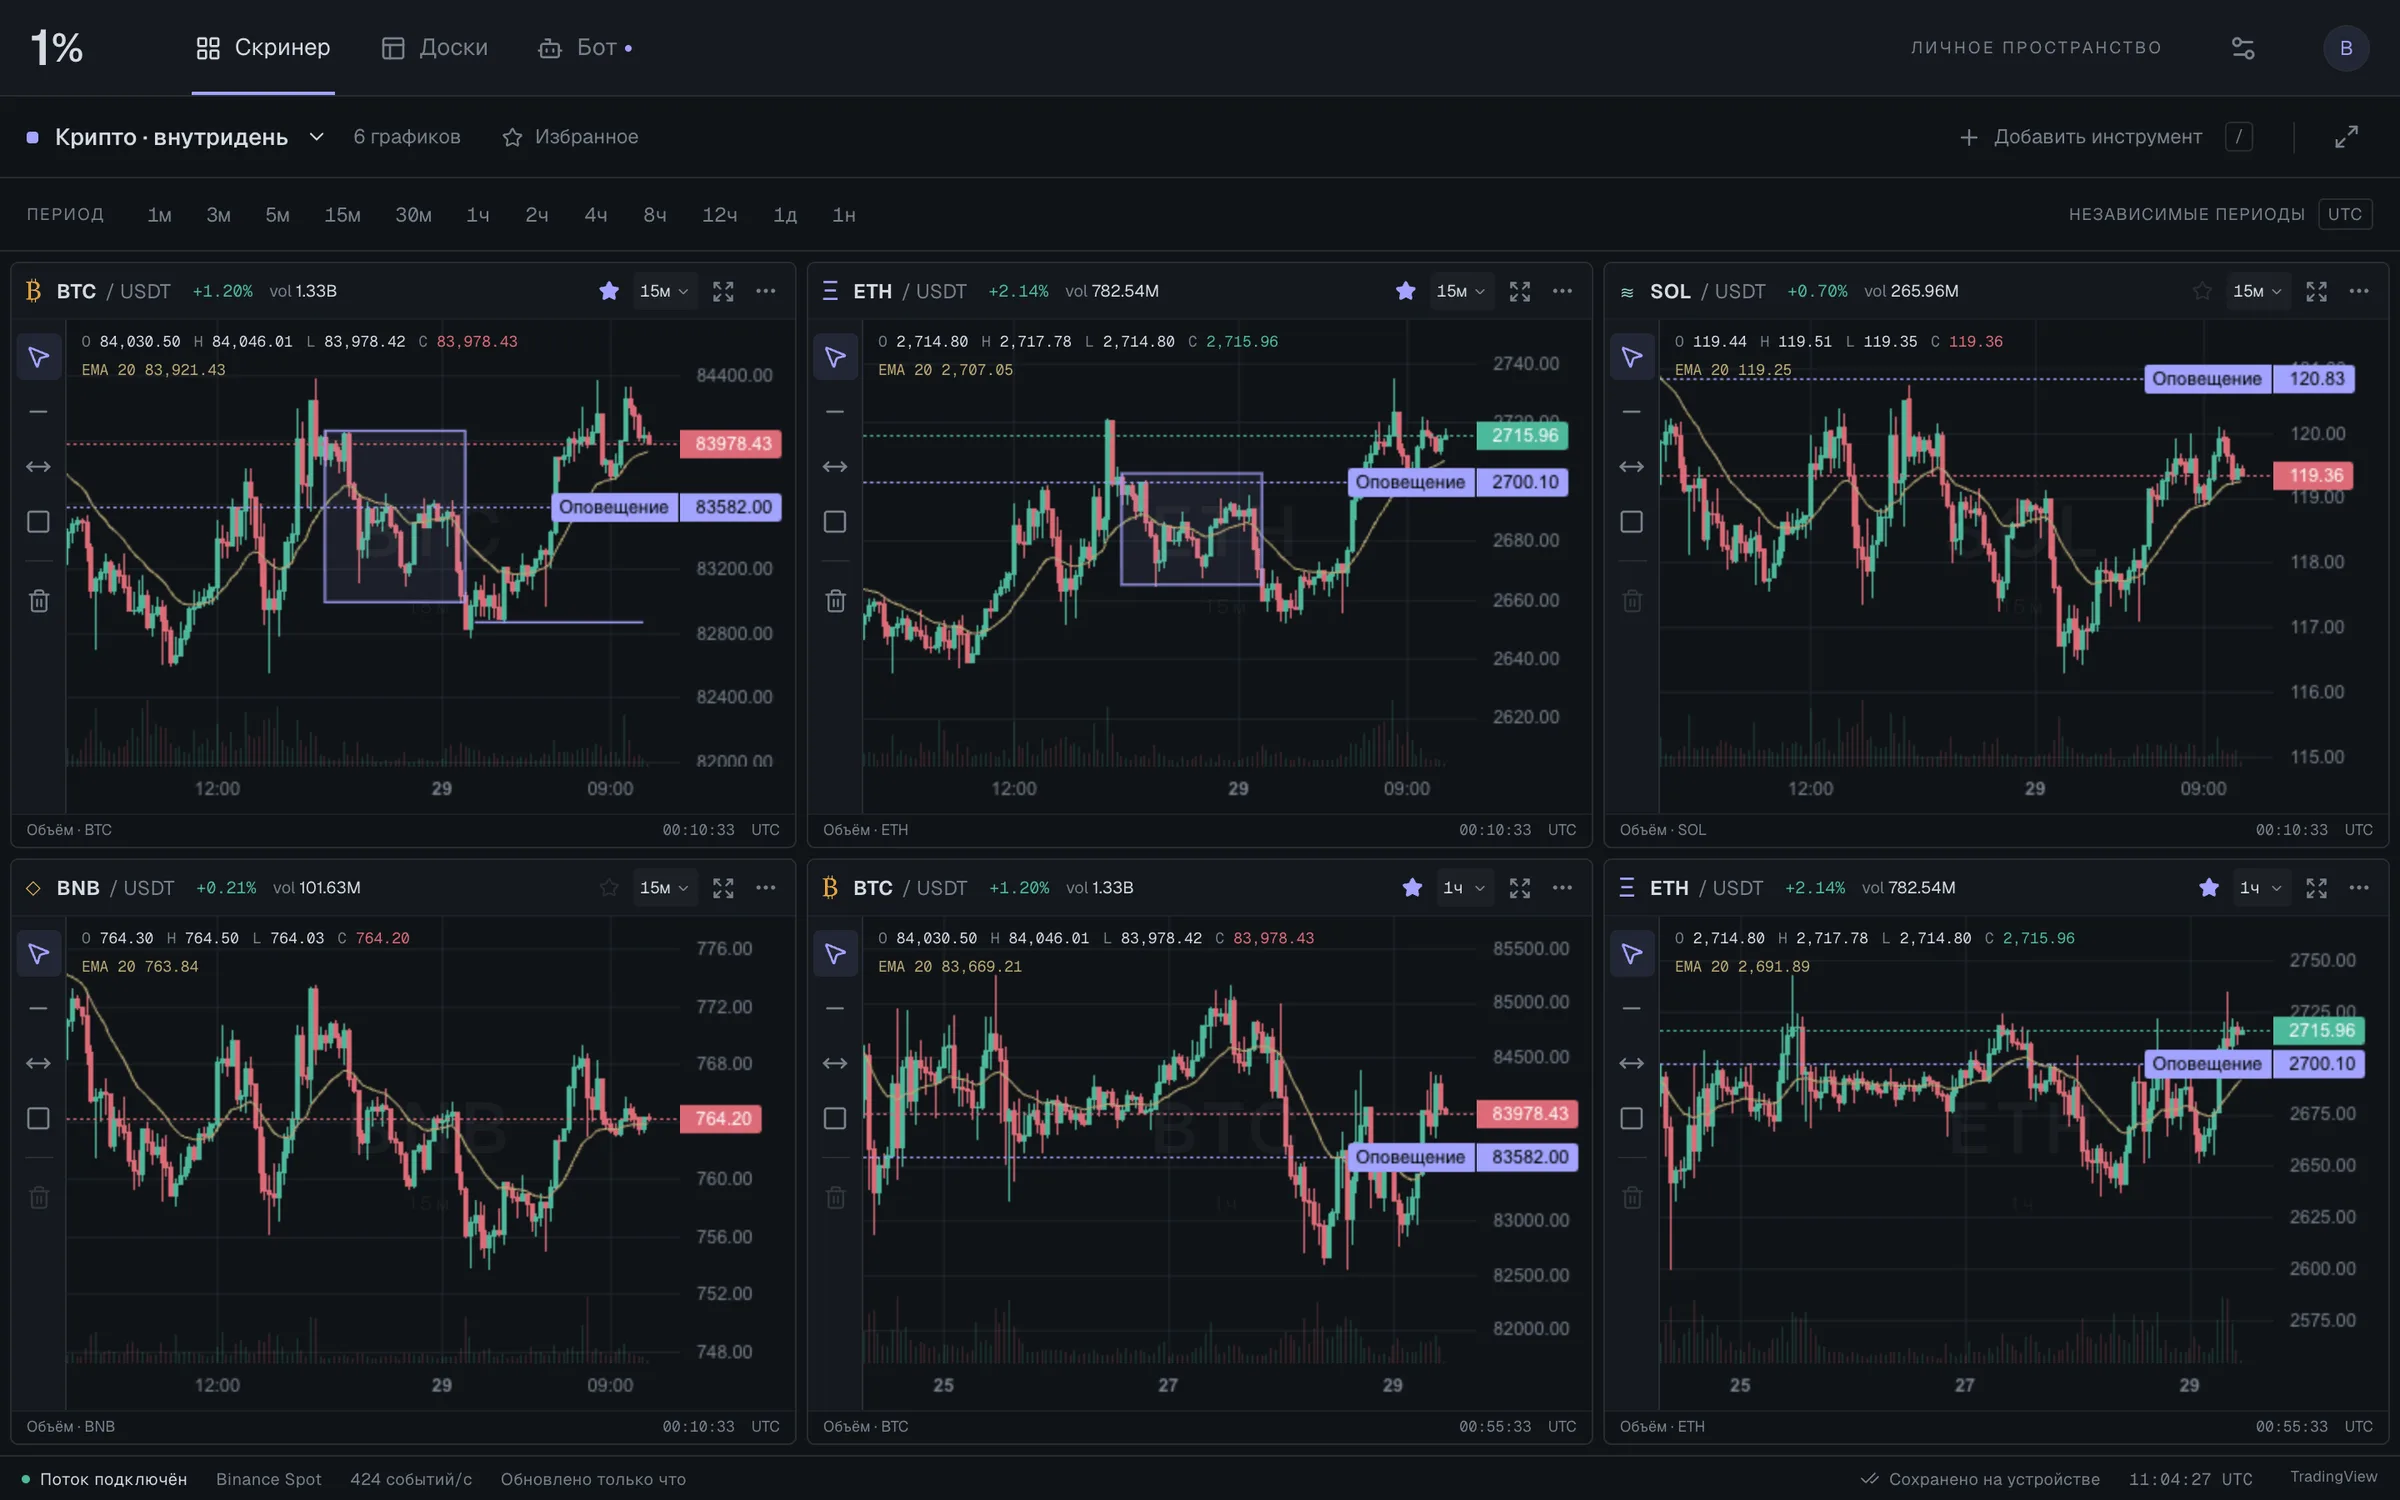
- 12-chart live board
- Web Worker stream, 40 ms batches
- Drawings & price alerts
- Impulse monitor — never trades
- Discipline
- AI & automation
- Year
- 2026
- Authorship
- Own build
- Status
- Role
- Solo: product, real-time data pipeline, UI and tests.
- Surfaces
- Desktop board · phone layout
- Languages
- RU · EN
- Stack
- React 19 · TypeScript · vinext (Vite) · Lightweight Charts · Canvas · Web Workers · Tailwind CSS 4 · node:test
- Links
- Walkthrough on request
Survey — context and problem.
The problem
Reading the same instruments on several timeframes meant a dozen browser tabs, drawings that did not follow the chart and a page that stuttered when the market moved.
Discretionary scalping — mostly gold on five-minute charts, with crypto majors alongside — starts with watching. Setups depend on structure across timeframes, so the same instruments have to be read on several periods at once, and a move of a fraction of a percent in a minute matters.
Browser charting sites are built for one chart at a time. A dozen tabs are slow to open, drawings and alert levels do not follow a chart from one layout to another, and a busy stream makes the page stutter exactly when the market is moving.
The brief for “1%” was a personal board: many live charts on one screen, each with its own timeframe, drawings and alerts, that stays smooth with a dozen charts streaming at once and flags fast price moves — while every trading decision stays with a person. The execution and signal side of the same workflow is shown on its own card (W-08).
Plan — the system, drawn first.
The solution
A personal board of up to 12 live charts: Binance Spot streamed through one WebSocket in a Web Worker, batched every 40 ms and drawn on Canvas, with drawings, price alerts, eight palettes and an impulse monitor that only notifies.
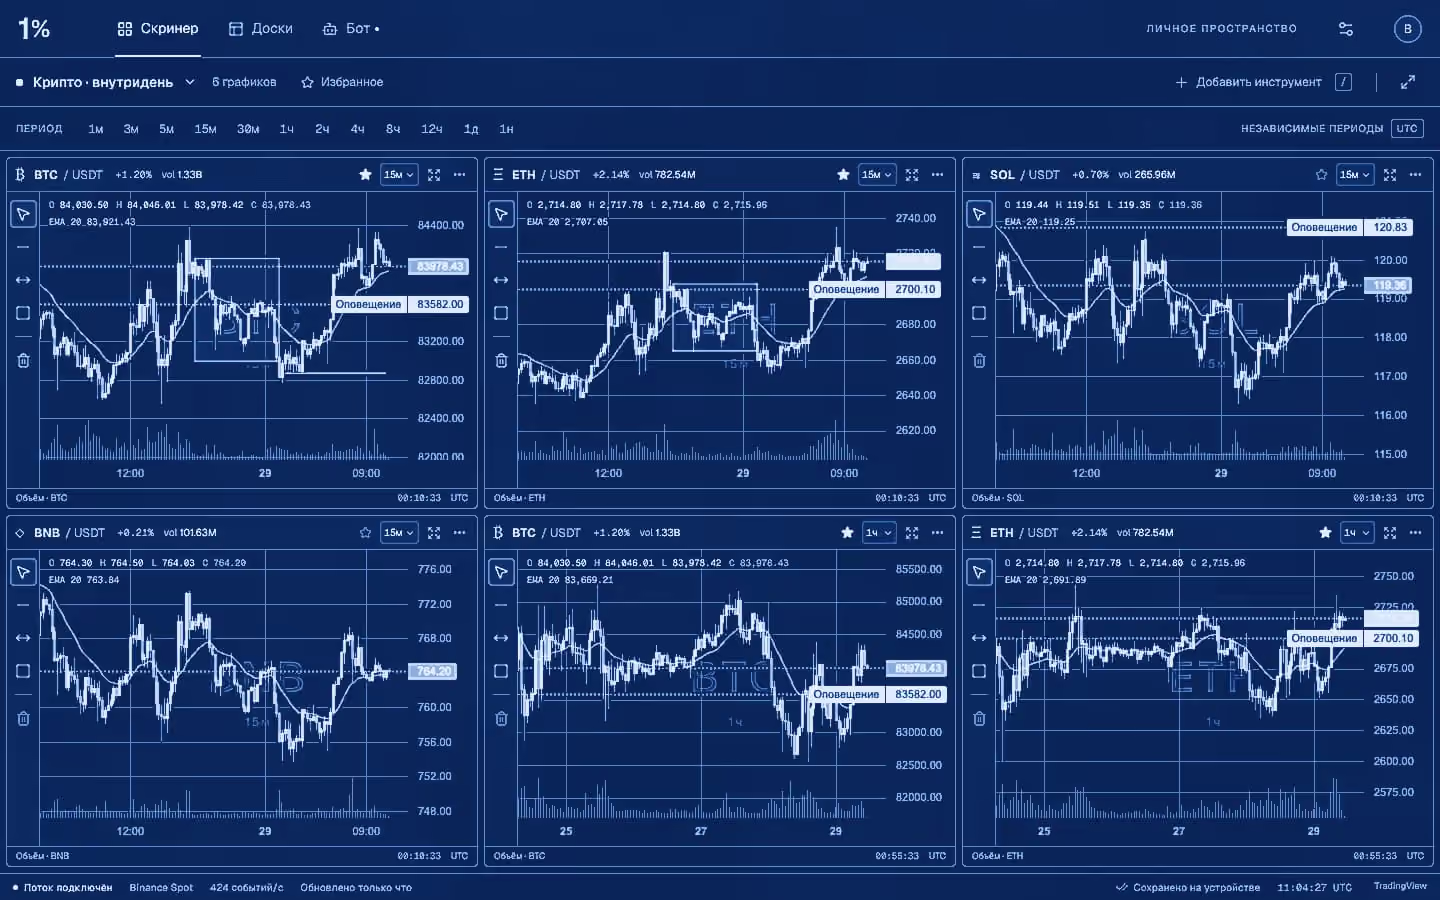
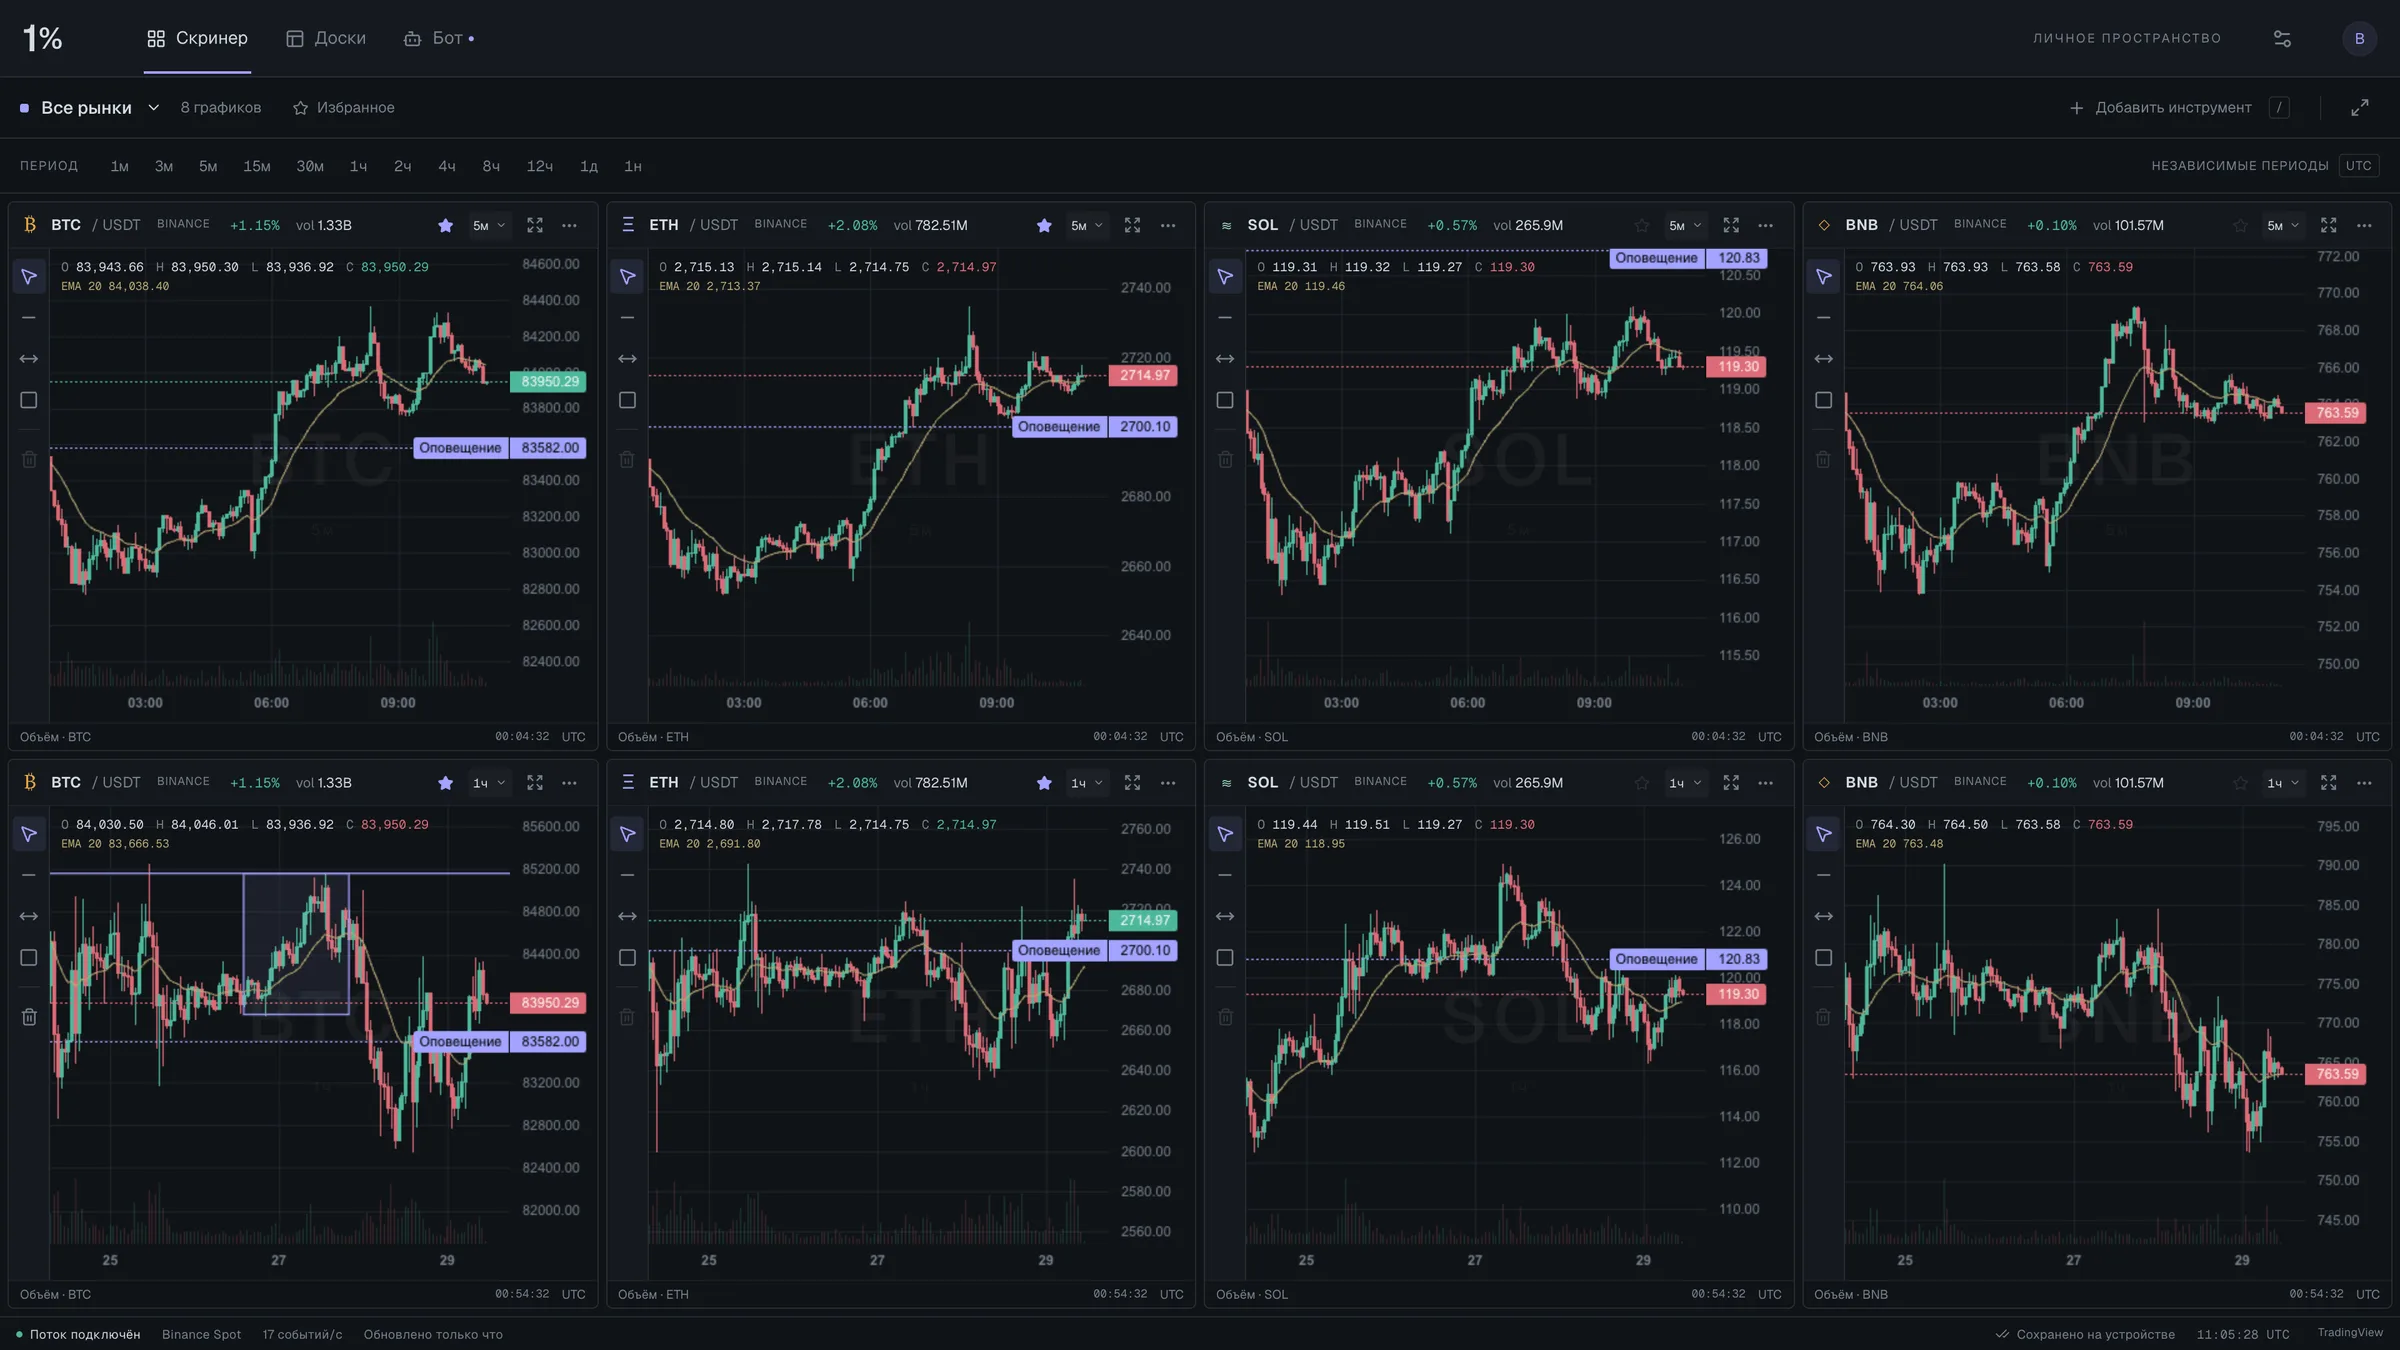
The “1%” board is one screen for watching many markets. Candle history comes through a small server proxy that validates the symbol and interval and caches briefly; live data arrives through one combined Binance Spot WebSocket inside a module Web Worker, which aggregates trades into candles, de-duplicates volume by trade ID, reconnects with backoff and posts batched updates every 40 ms. Each chart is drawn on Canvas with TradingView Lightweight Charts on animation frames, while React only updates metadata a few times a second. A board holds 1–4 columns and up to 12 charts across twelve timeframes from 1m to 1w — shared or independent per chart — with focus and full-screen modes. Drawings and price alerts are saved per chart and instrument, eight candle palettes and independent light and dark themes change the look, and a minute-impulse monitor logs fast moves and plays a sound. It notifies; it never trades.
Module key
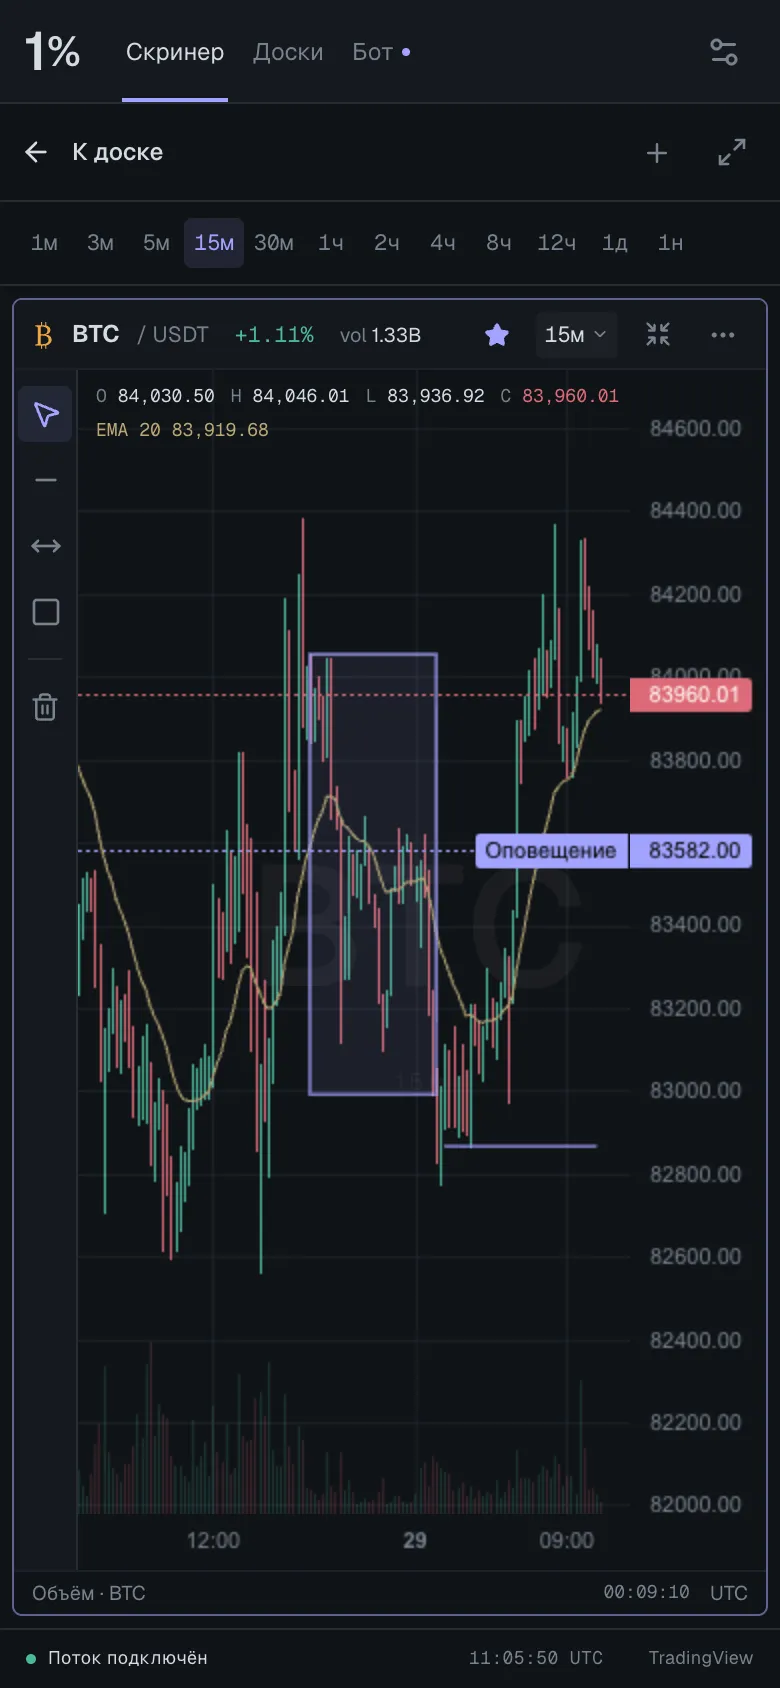
- Boards of 1–4 columns and up to 12 charts, with focus and full-screen modes
- 12 timeframes from 1m to 1w; shared or independent periods per chart
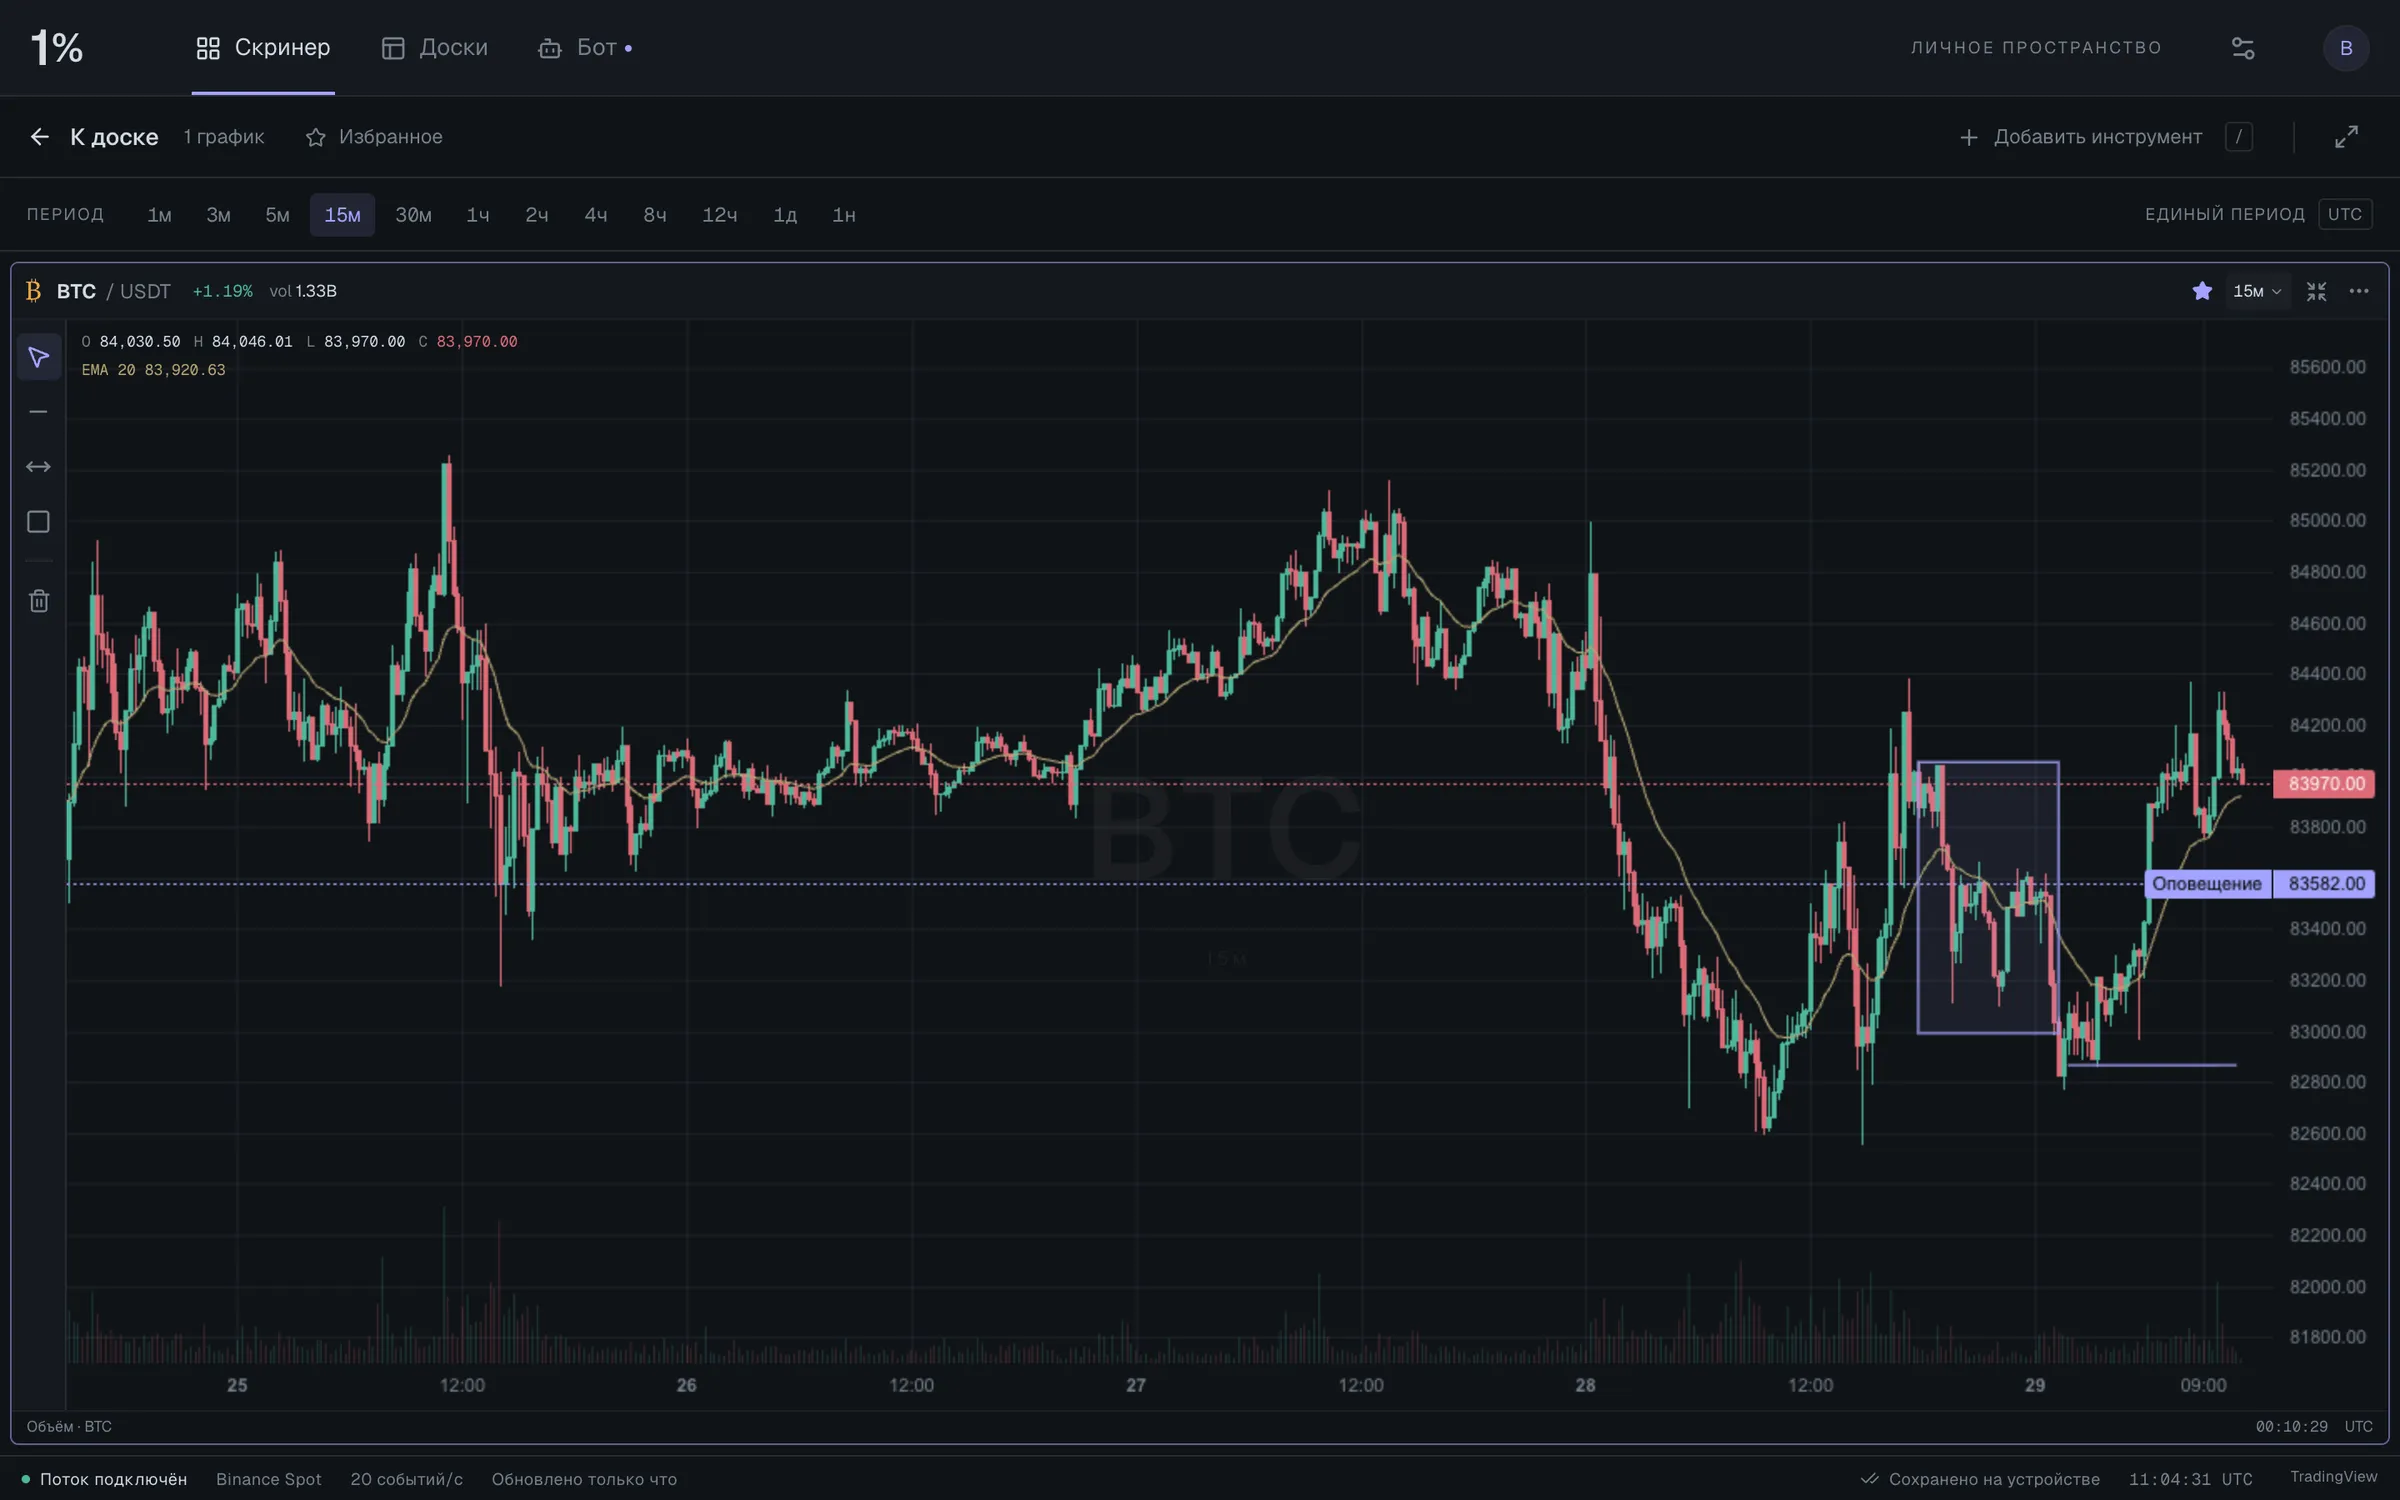
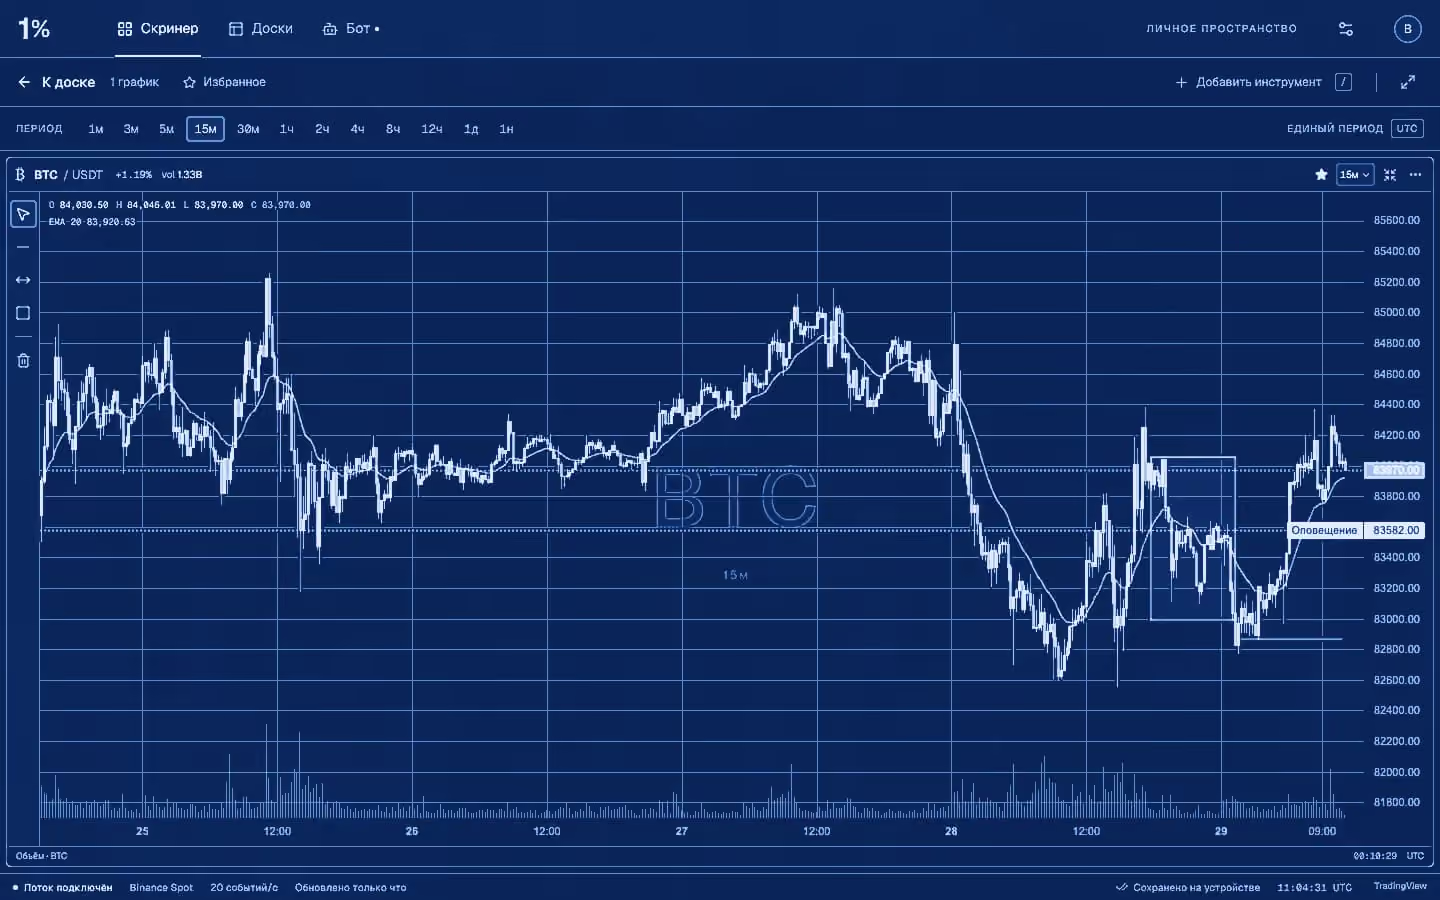
- Drawing tools — horizontal line, segment, rectangle — anchored to time and price and saved per chart and instrument
- Price alerts on level cross, set with a click on the chart
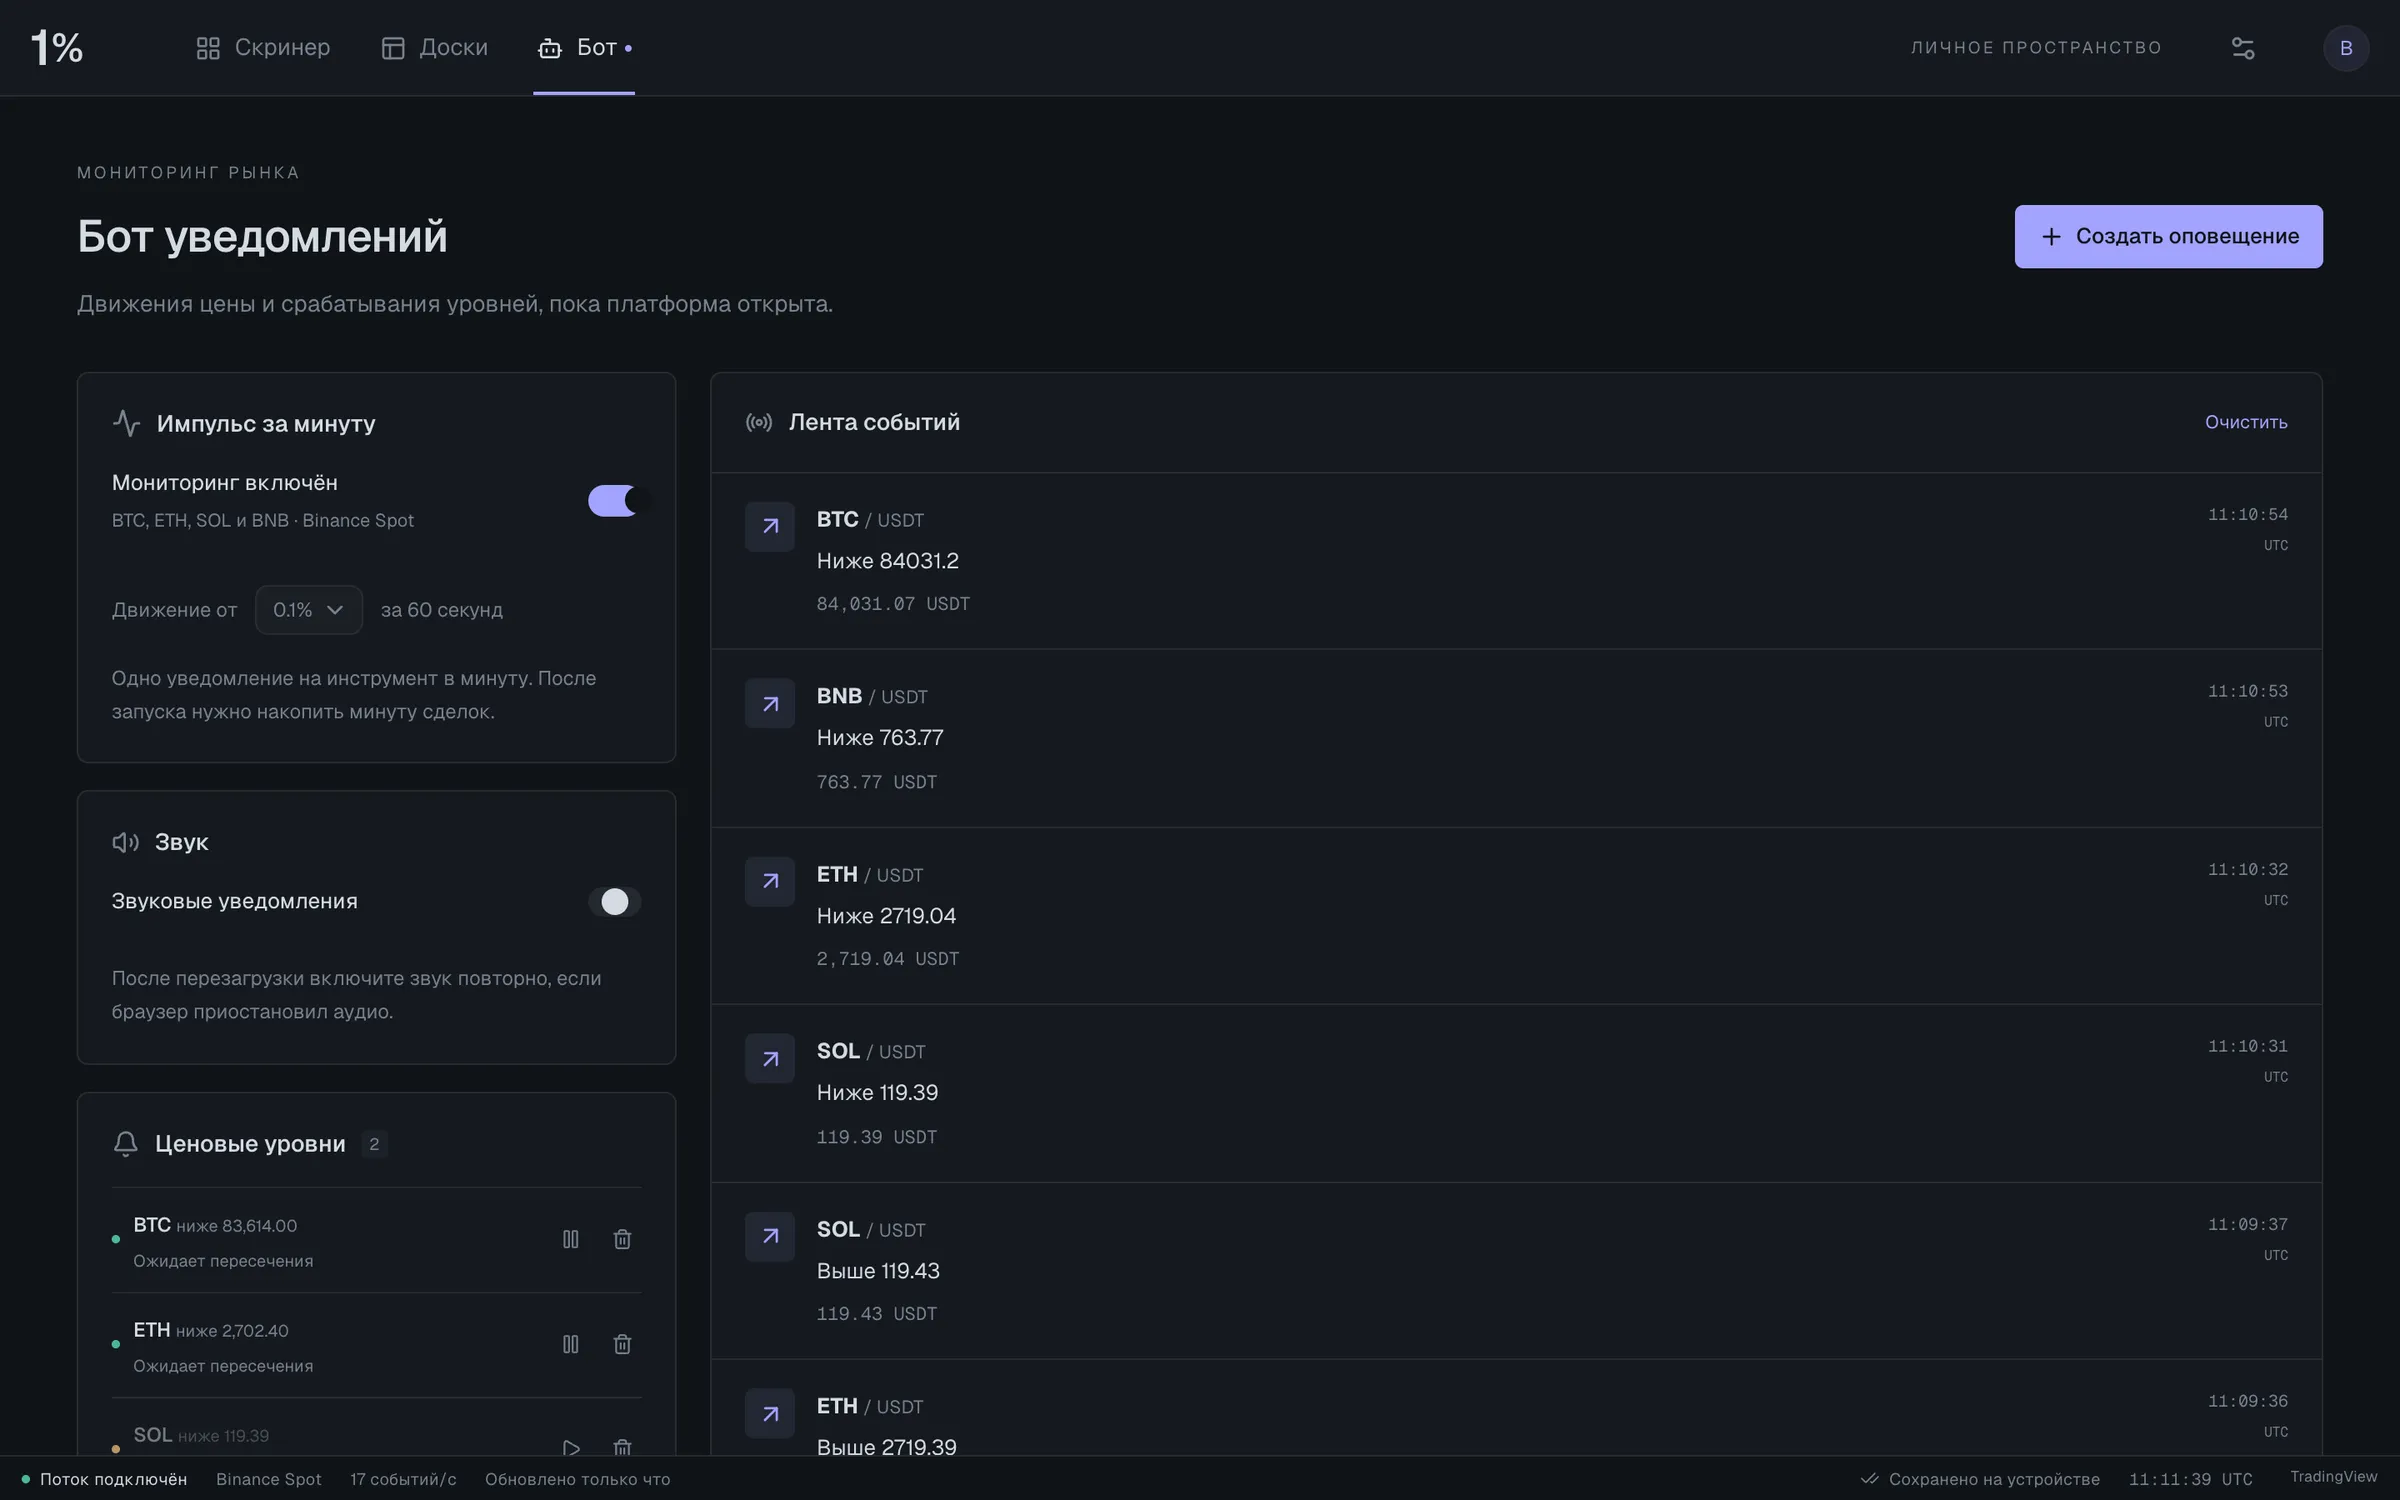
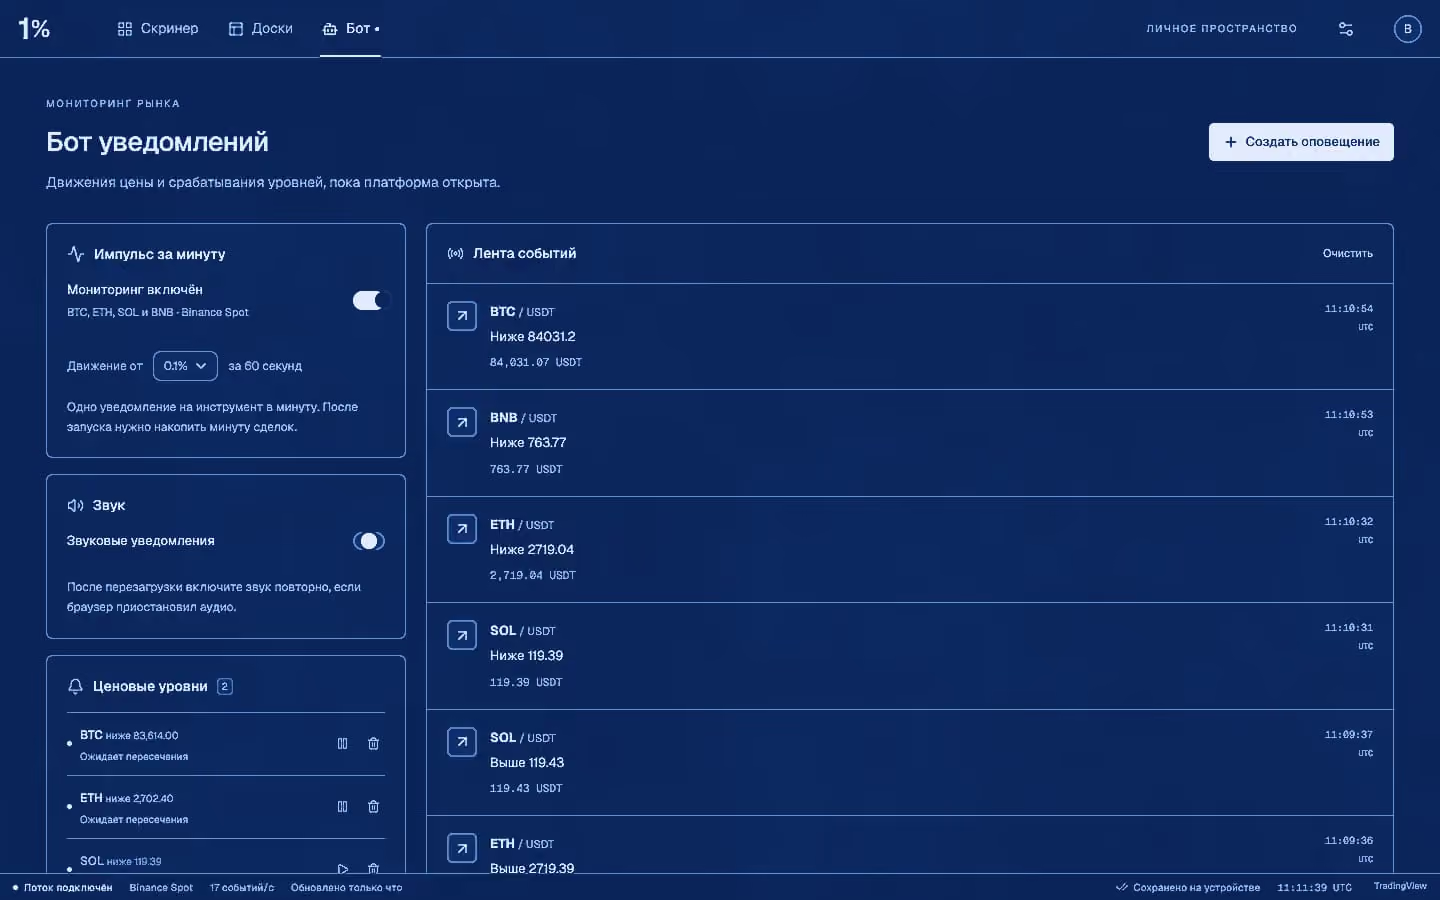
- Minute-impulse monitor with an event log — it notifies and never trades
- Eight candle palettes and independent light and dark themes
- EMA 20, volume, 24h high and low and a candle-close countdown on every chart
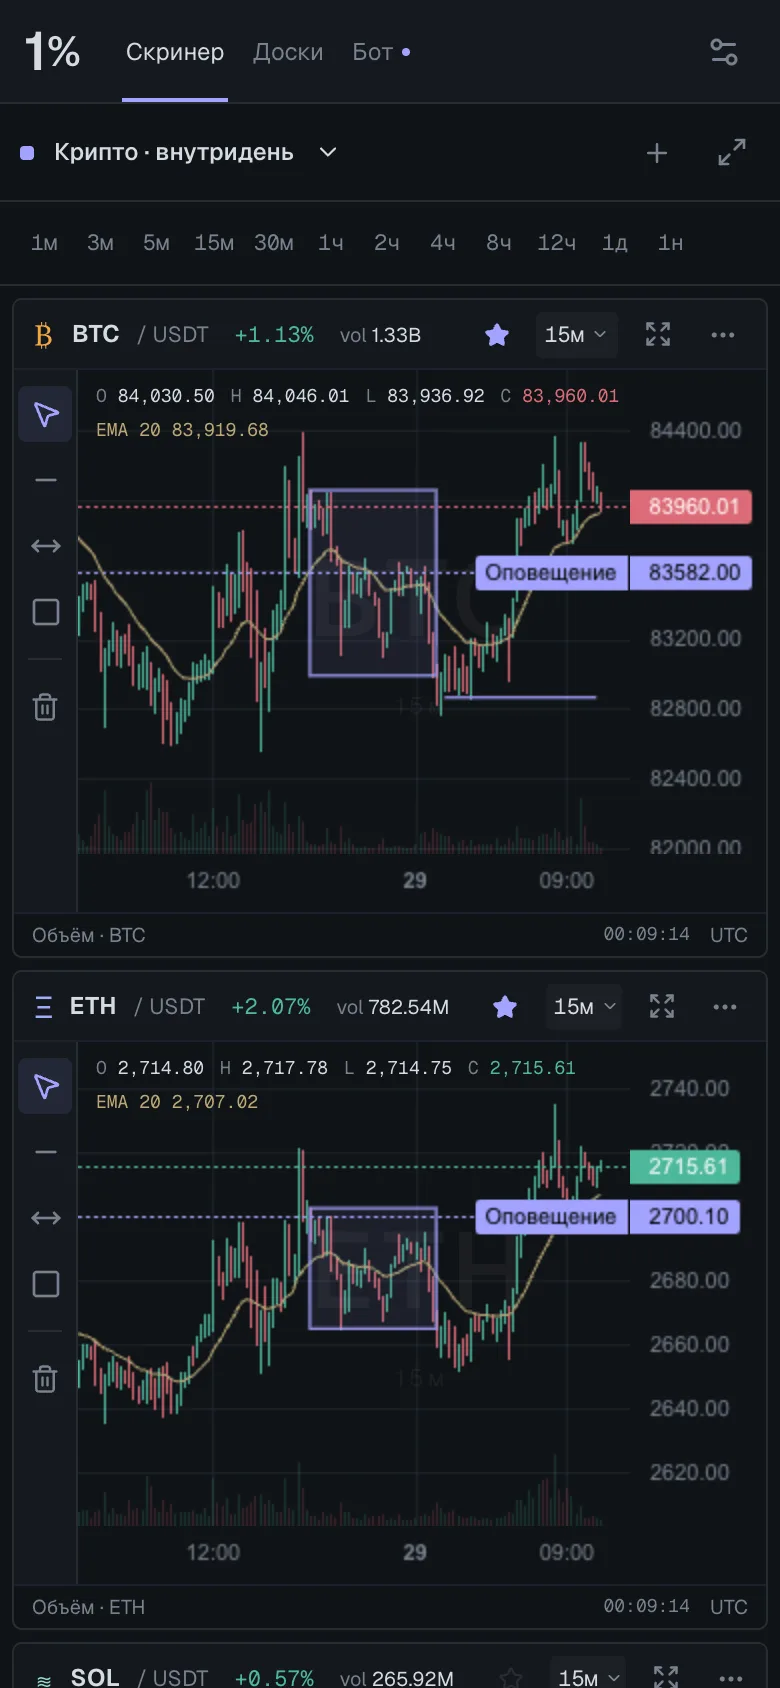
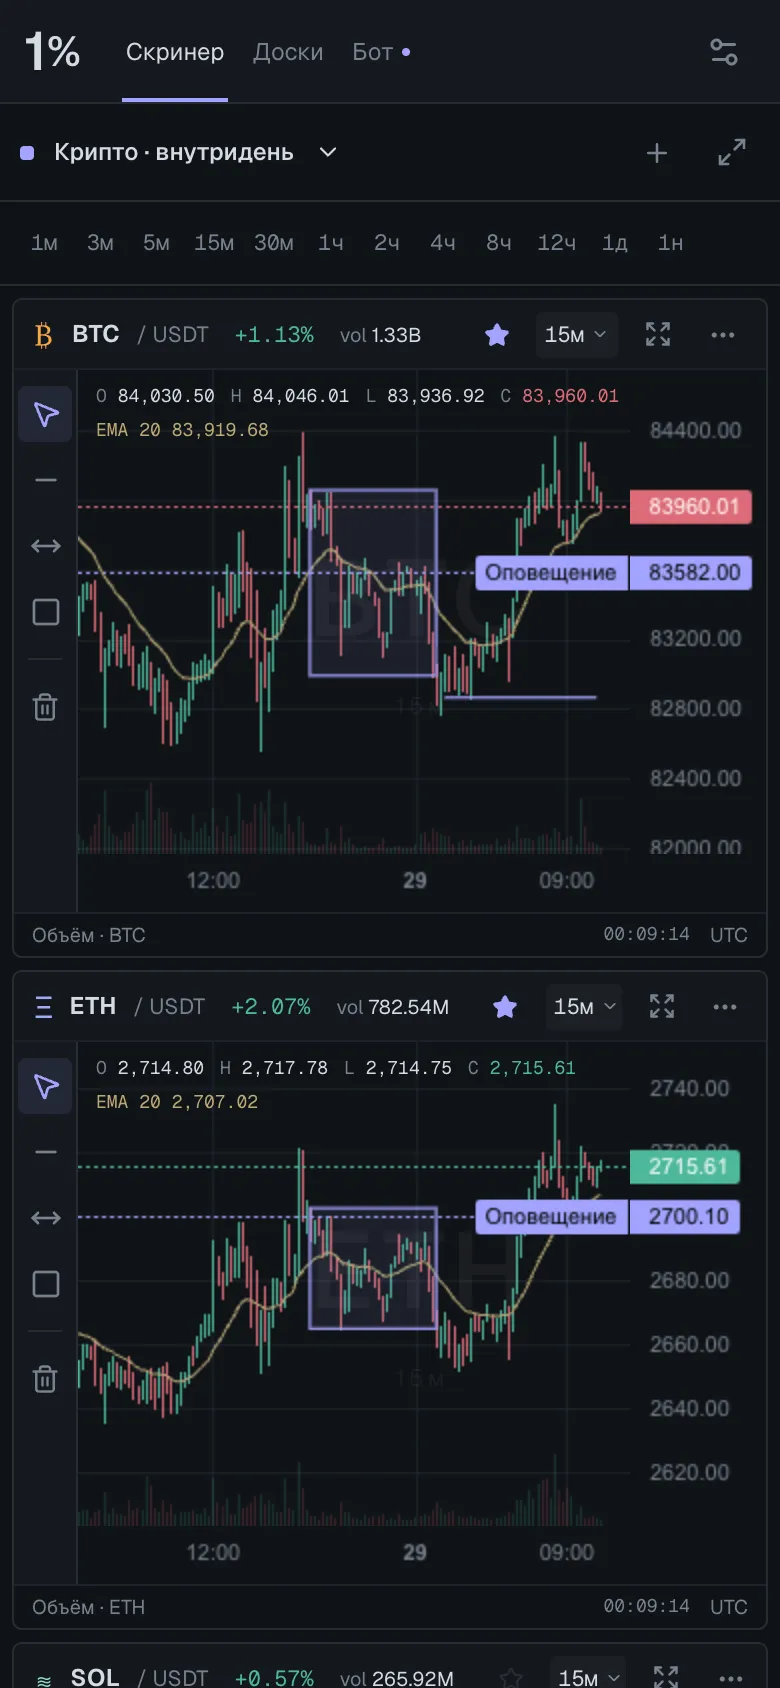
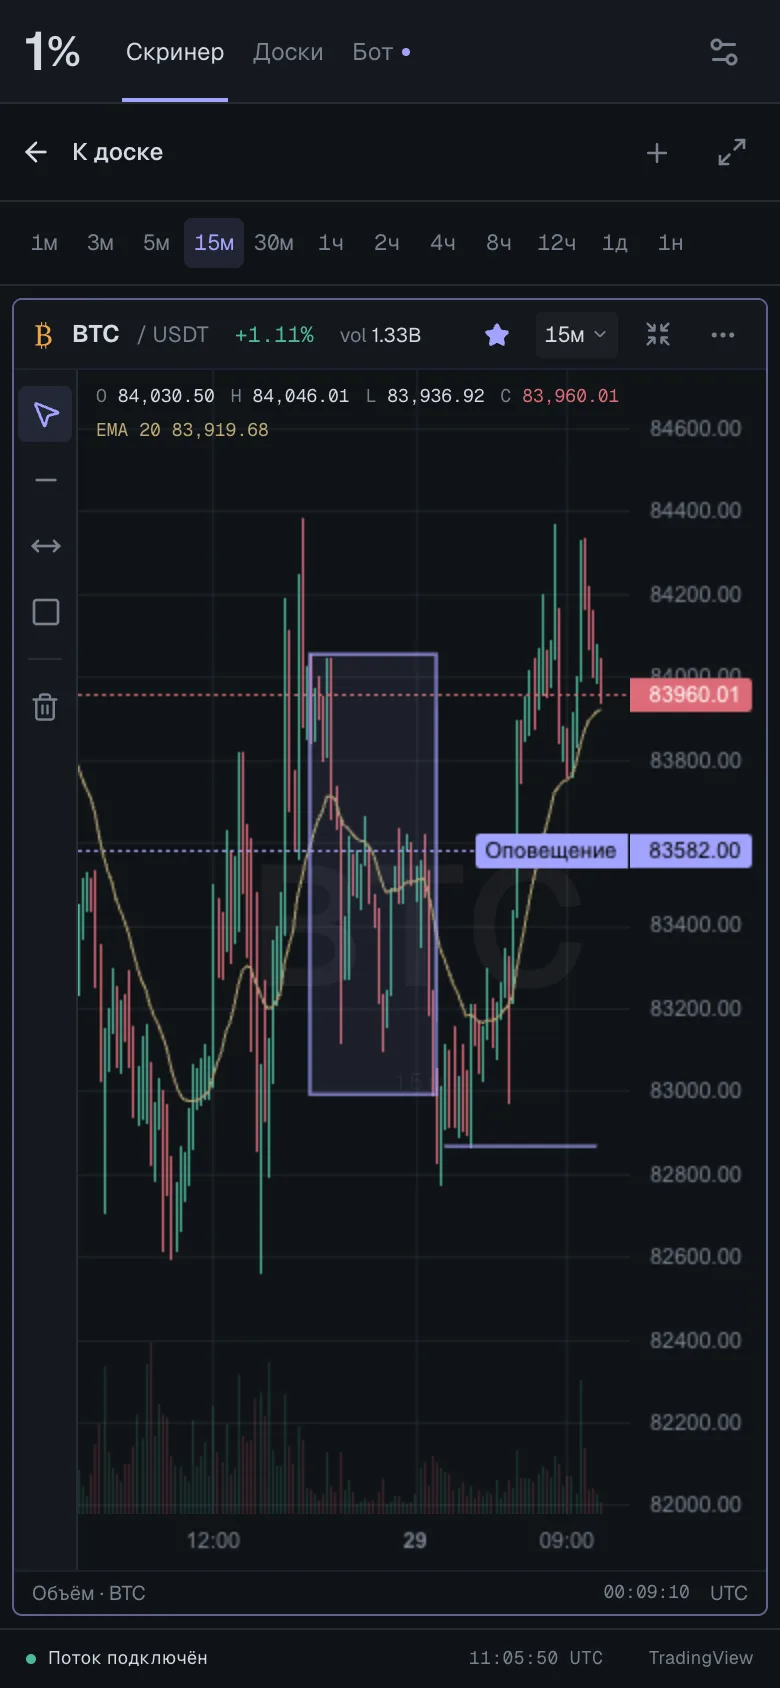
- Charts stack into one column on a phone, with drawings and alerts still available
Key decisions
-
Why the stream runs in a Web Worker
Parsing and aggregating ticks off the main thread, batching every 40 ms and drawing on animation frames keeps a dozen live charts responsive; charts that are off-screen pause.
-
Why one combined socket
Every symbol on the board shares one WebSocket, so adding a chart does not open another connection. Reconnects back off and are tagged with an epoch, so a late message from an old connection cannot overwrite fresh candles.
-
Why the monitor never trades
The minute-impulse monitor reads the stream, logs fast moves and plays a sound — it has no path to an order. Trading decisions stay with a person; execution is a separate, confirmed workflow (W-08).
-
Why an alert fires once
A crossed alert level fires once and records the event instead of repeating on every tick around the level; tests pin this rule down, together with reconnect races and timeframe boundaries.
Elevations — the desktop screens.
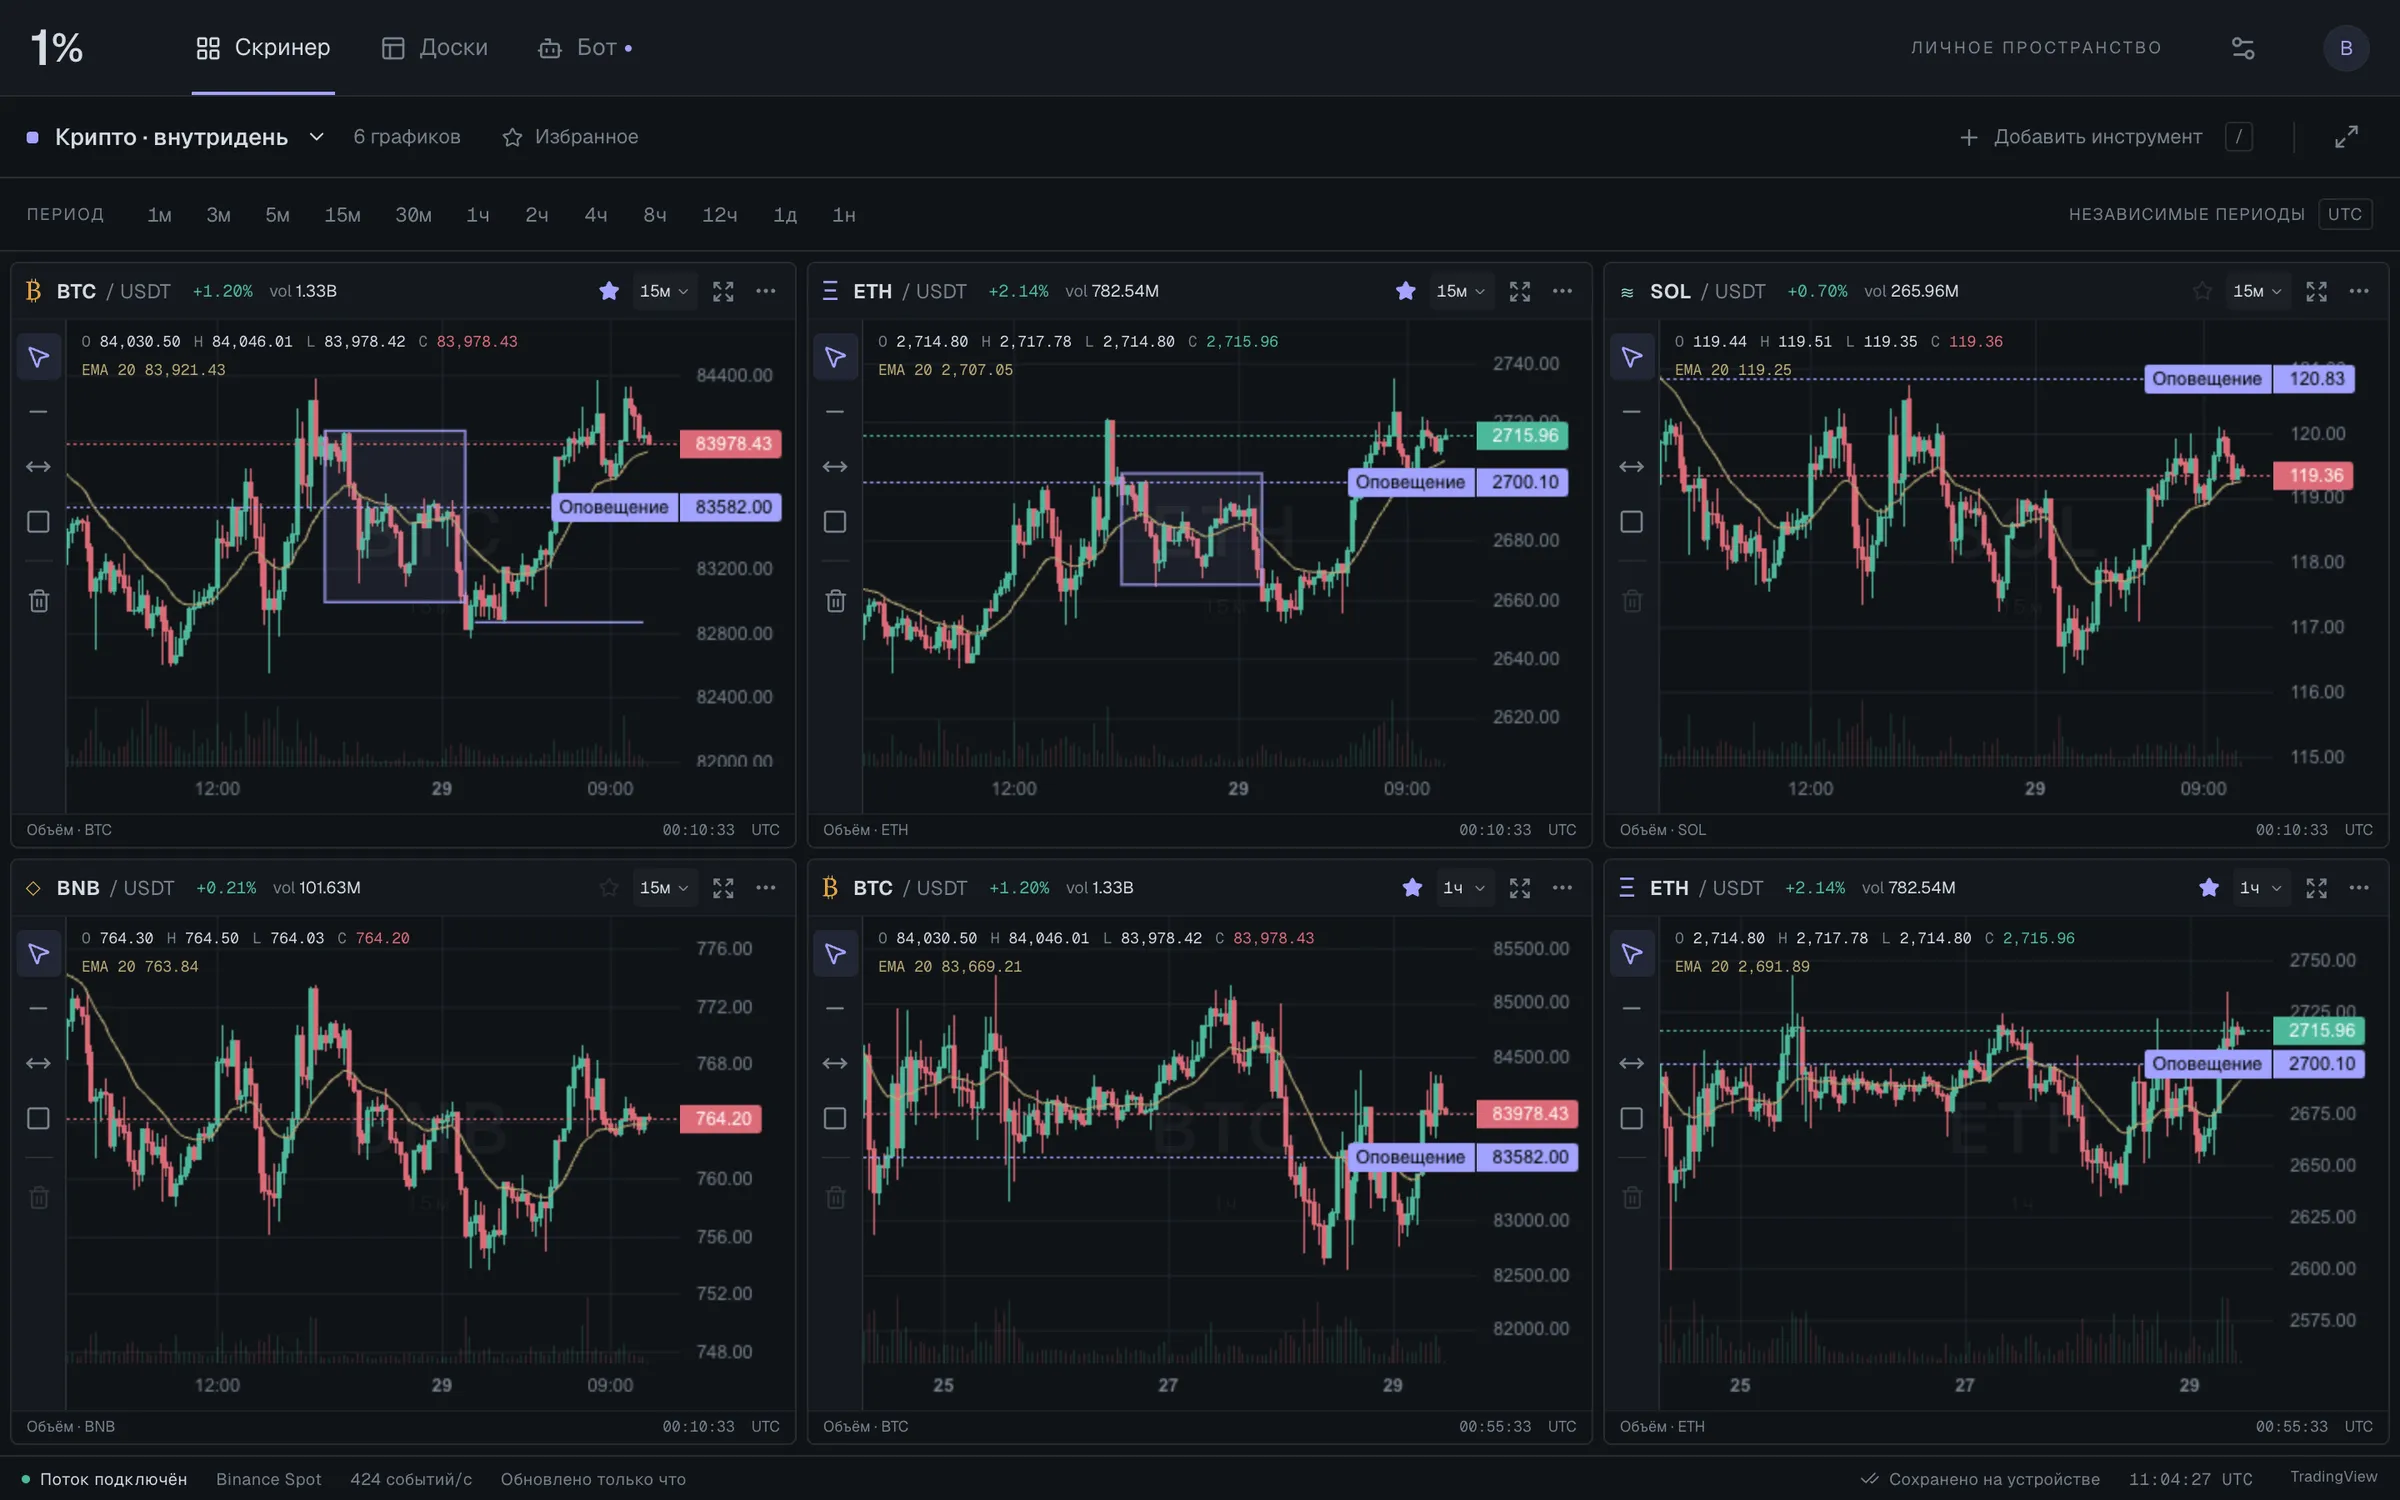
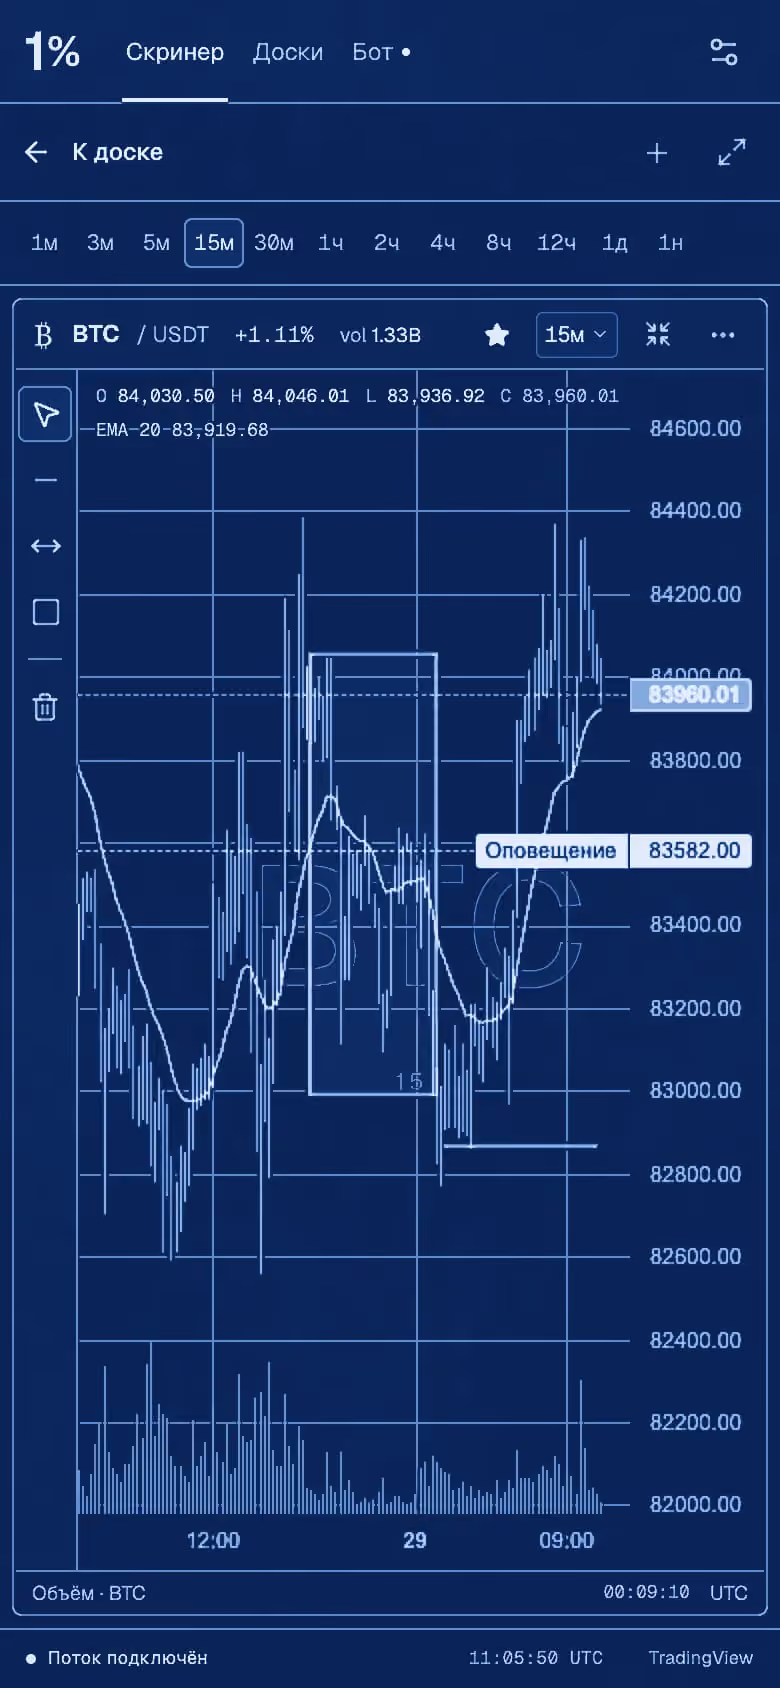


All elevations 04
-
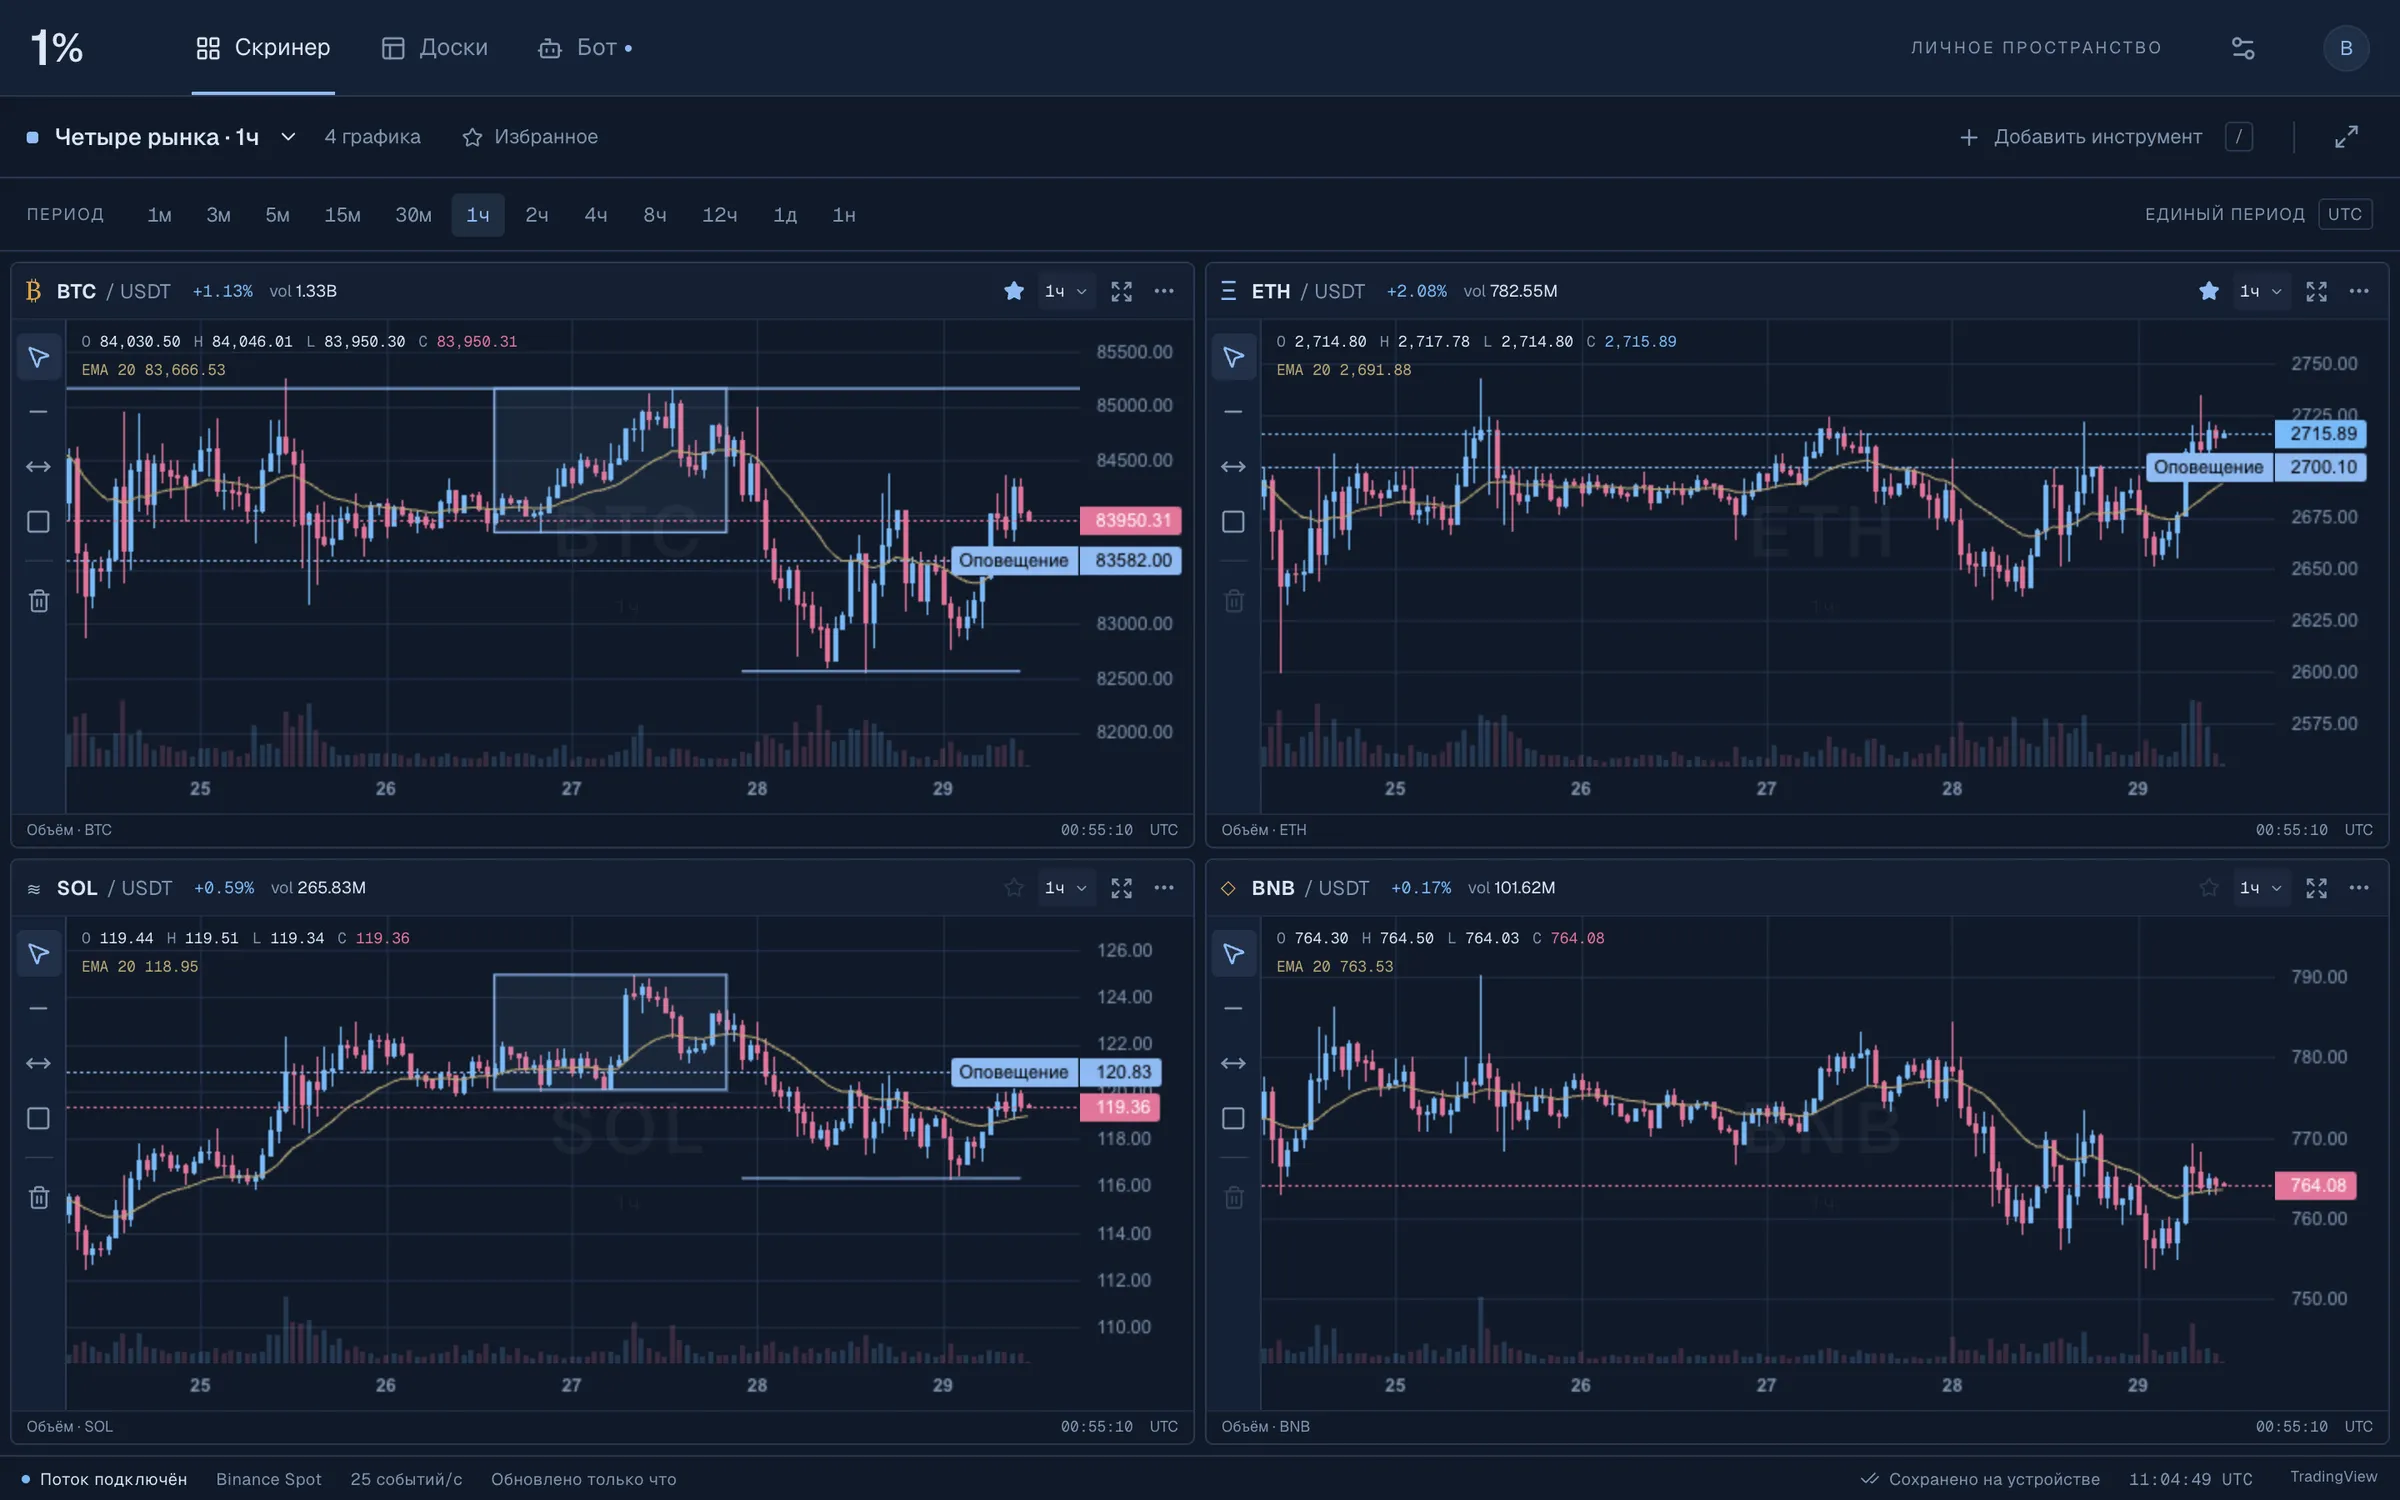
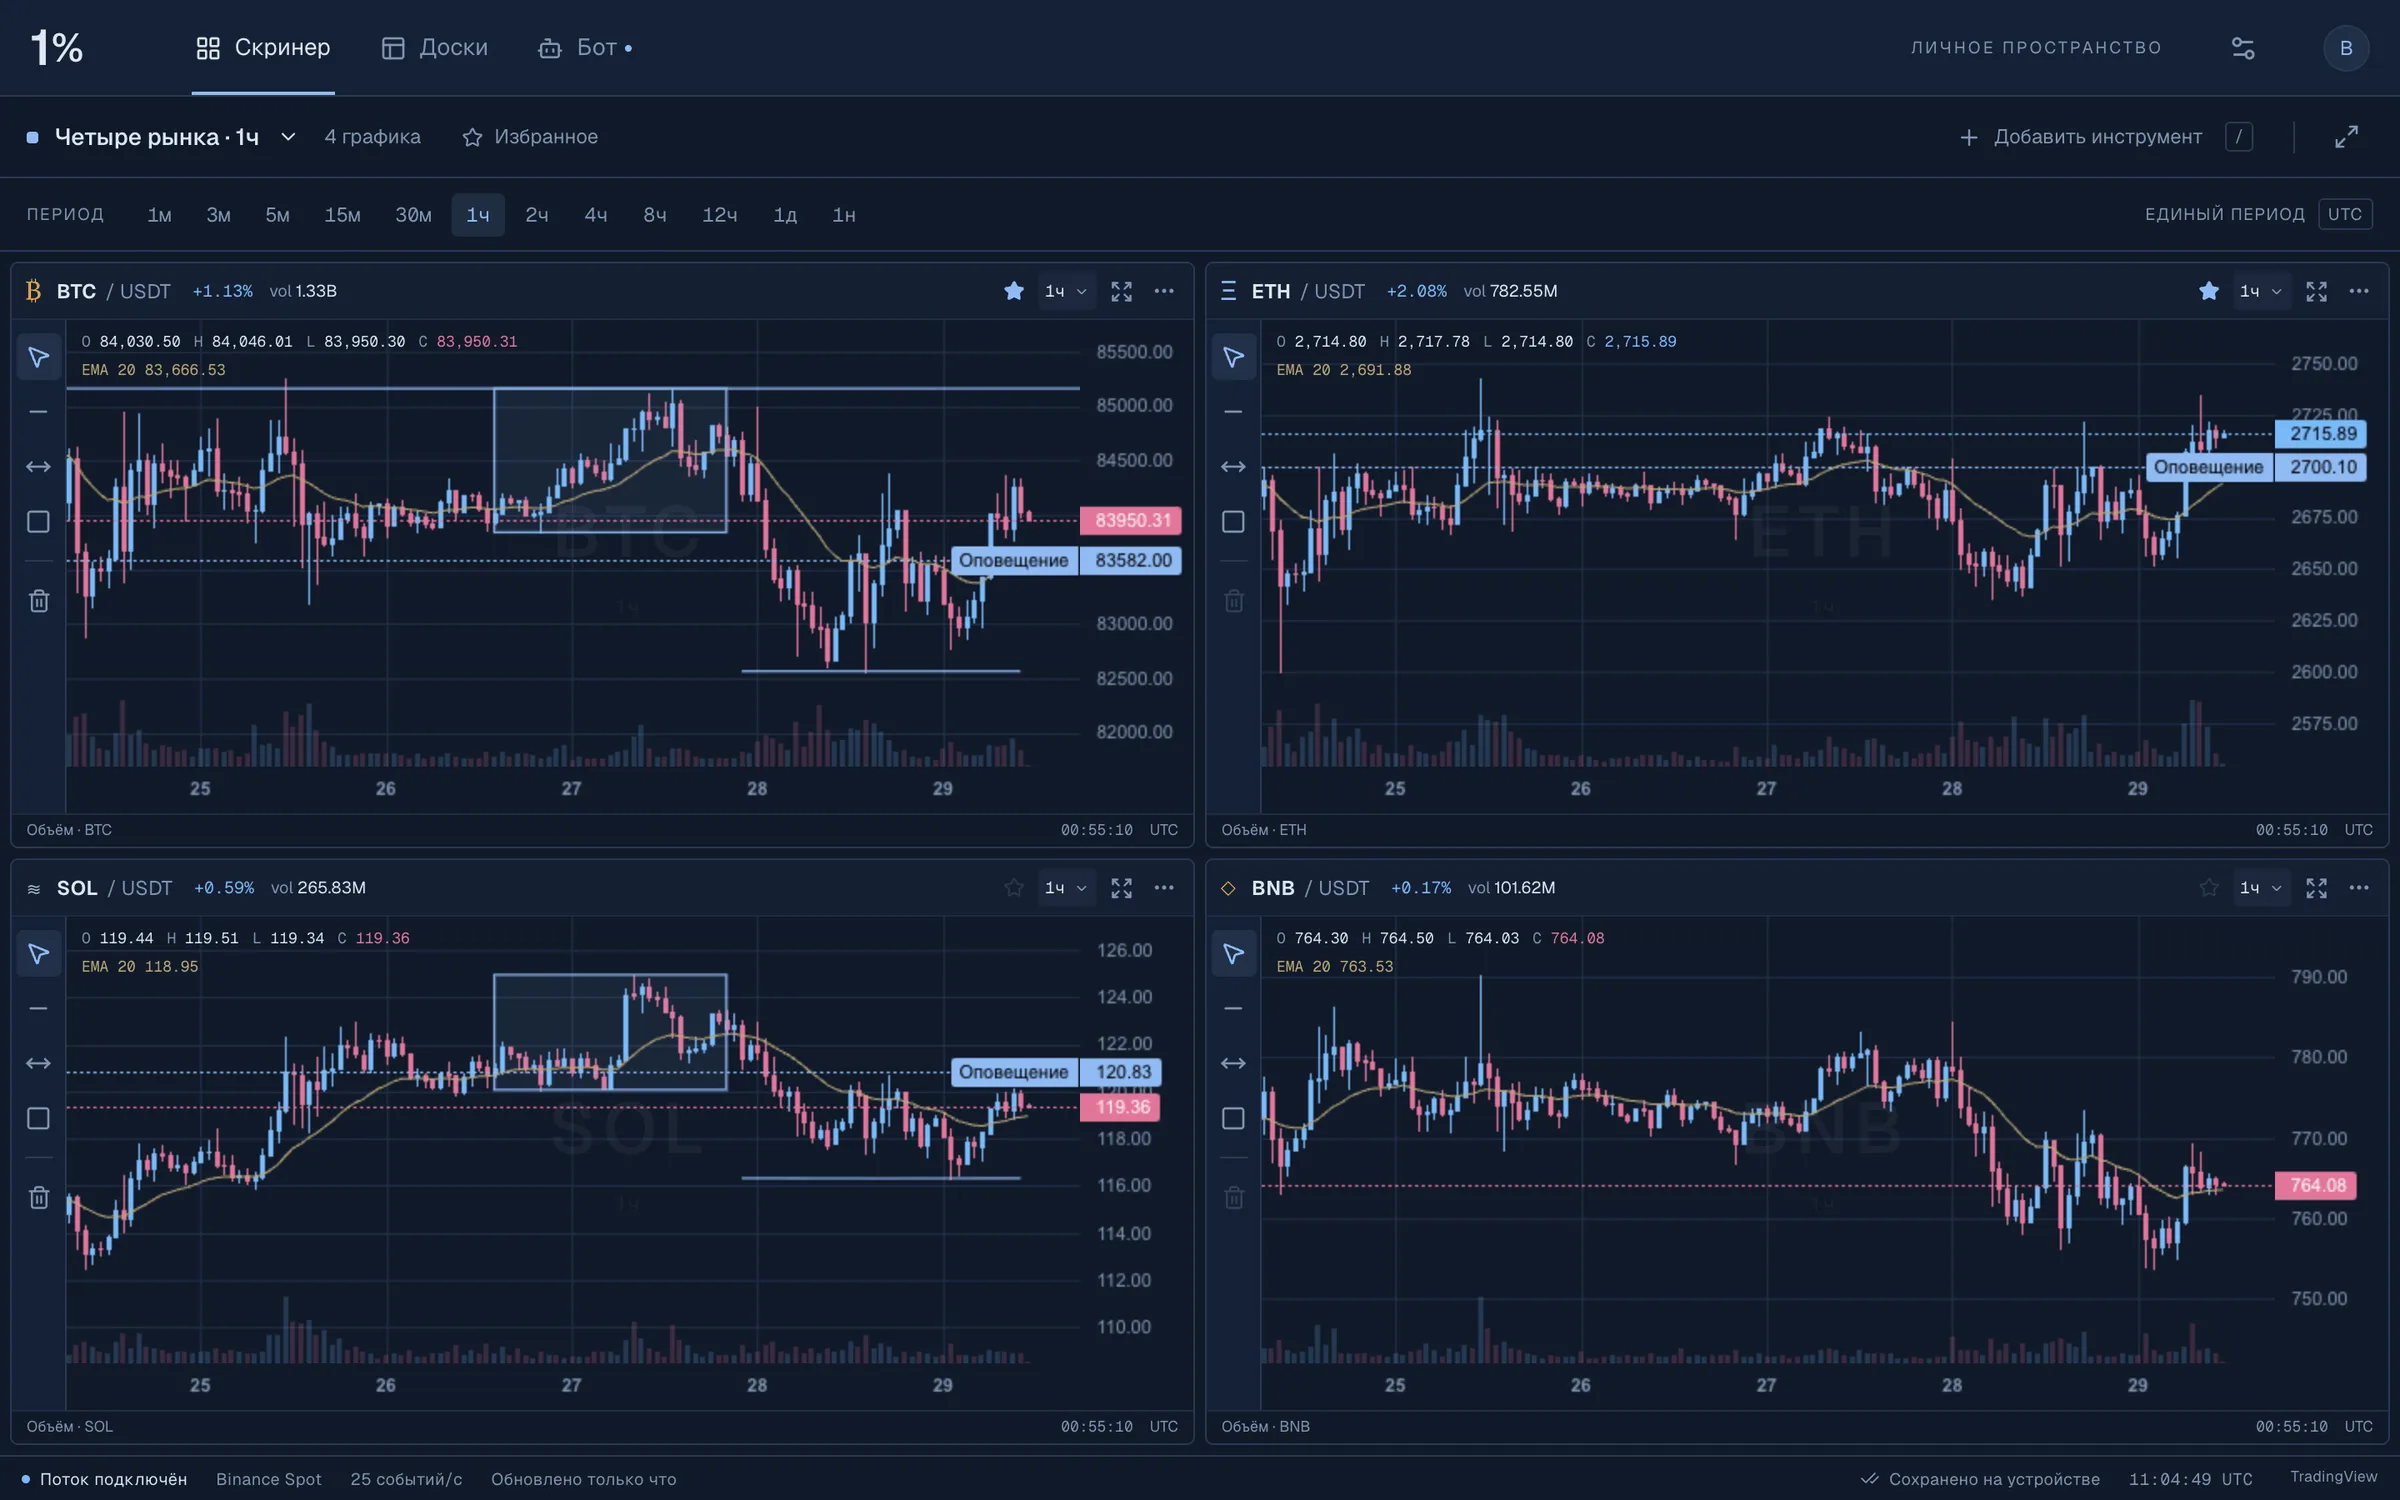
Fig. 4.1 A second 2 × 2 board — BTC, ETH, SOL and BNB on 1h — in the blue “Glacier” candle palette, with per-chart drawings and alert levels. -
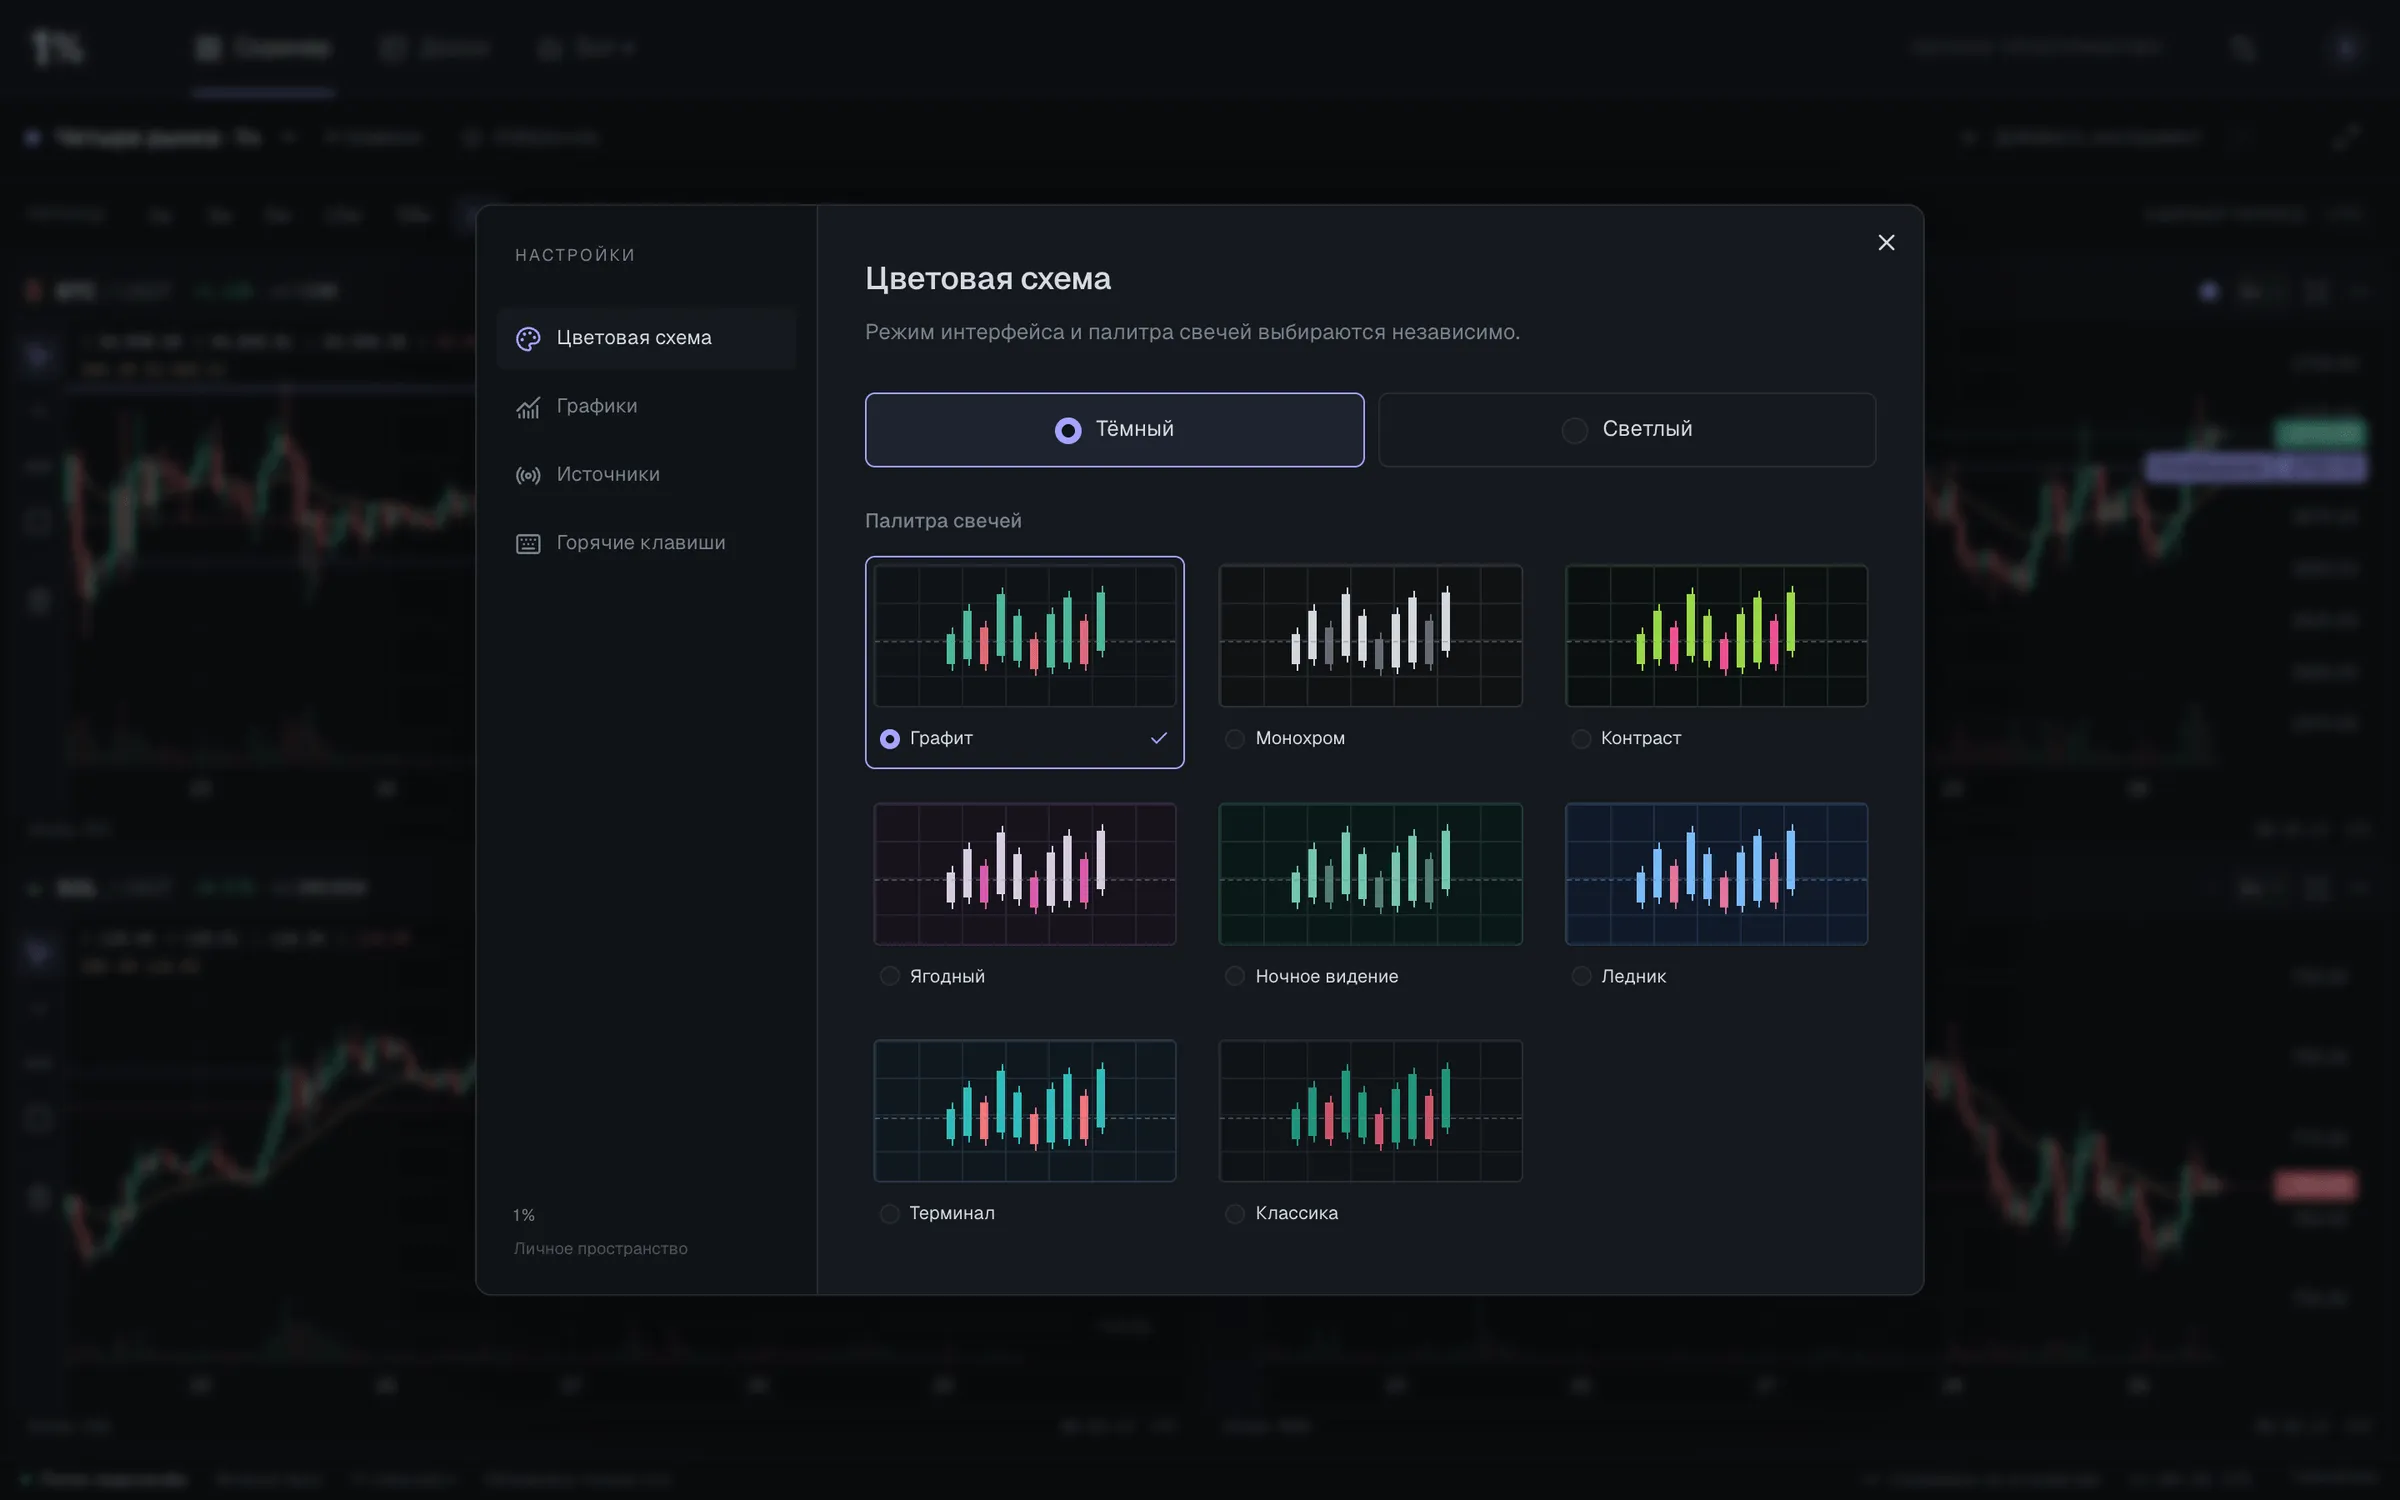
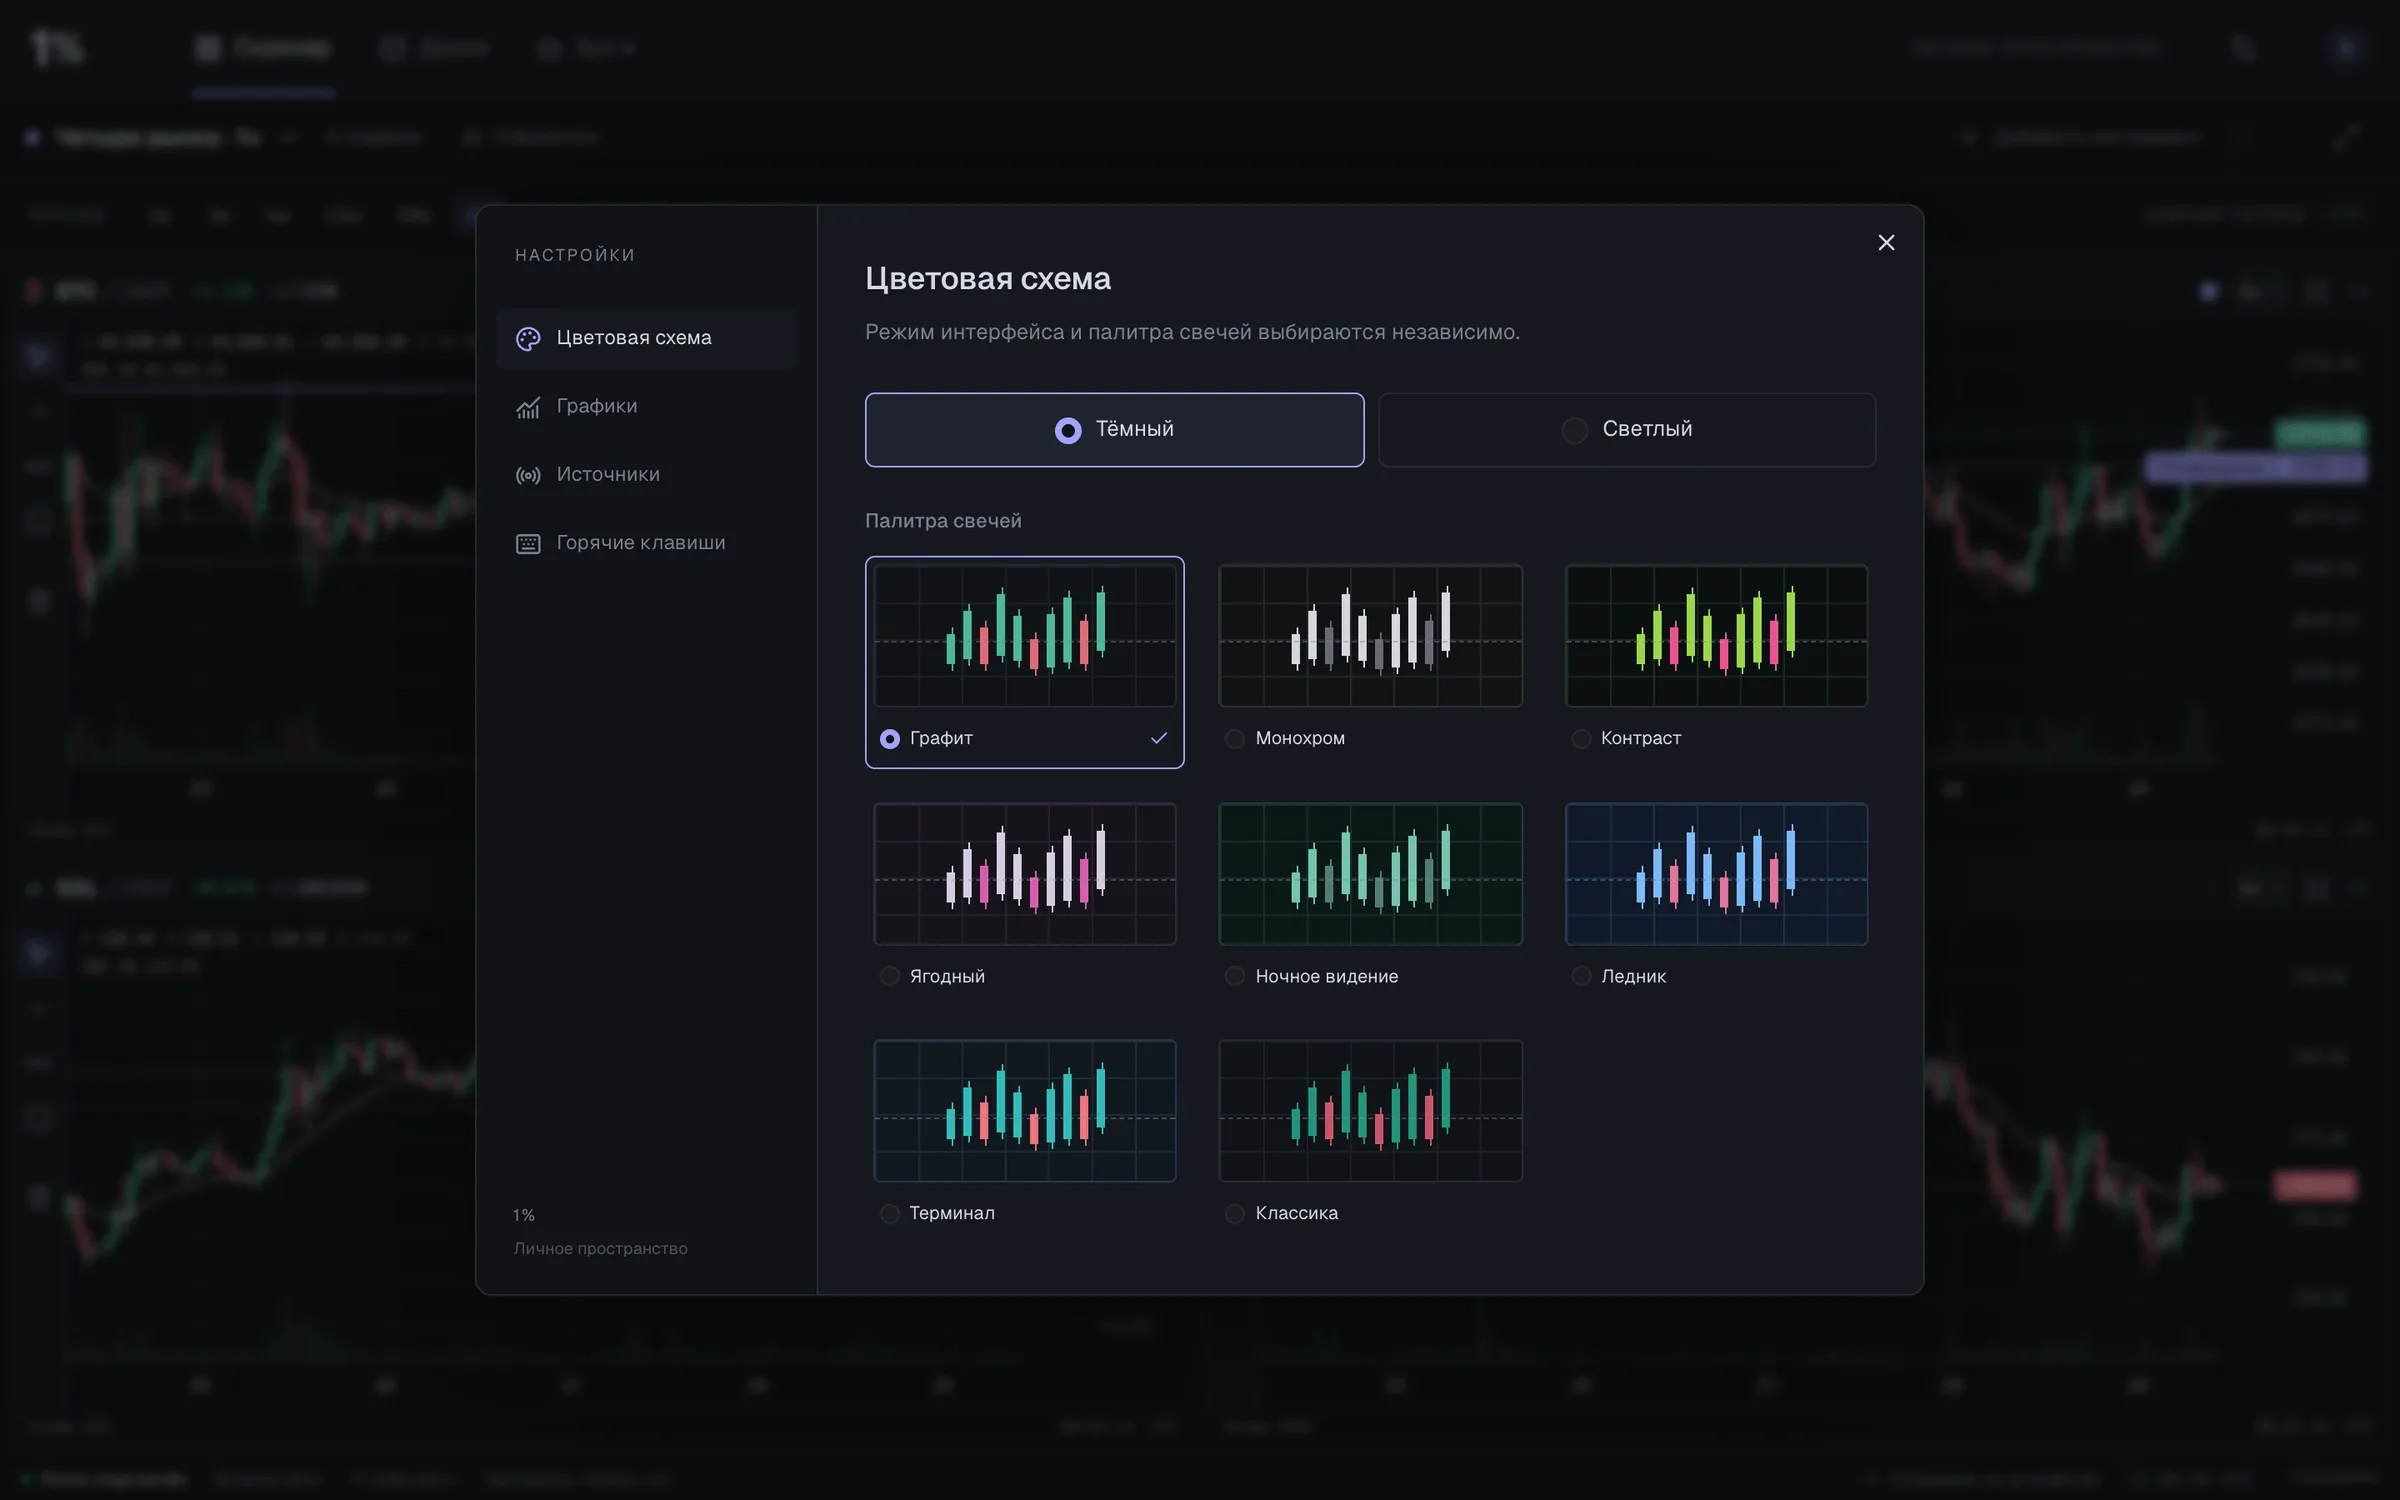
Fig. 4.2 Settings dialog with an independent dark / light interface switch and eight candle palettes previewed as mini charts. -
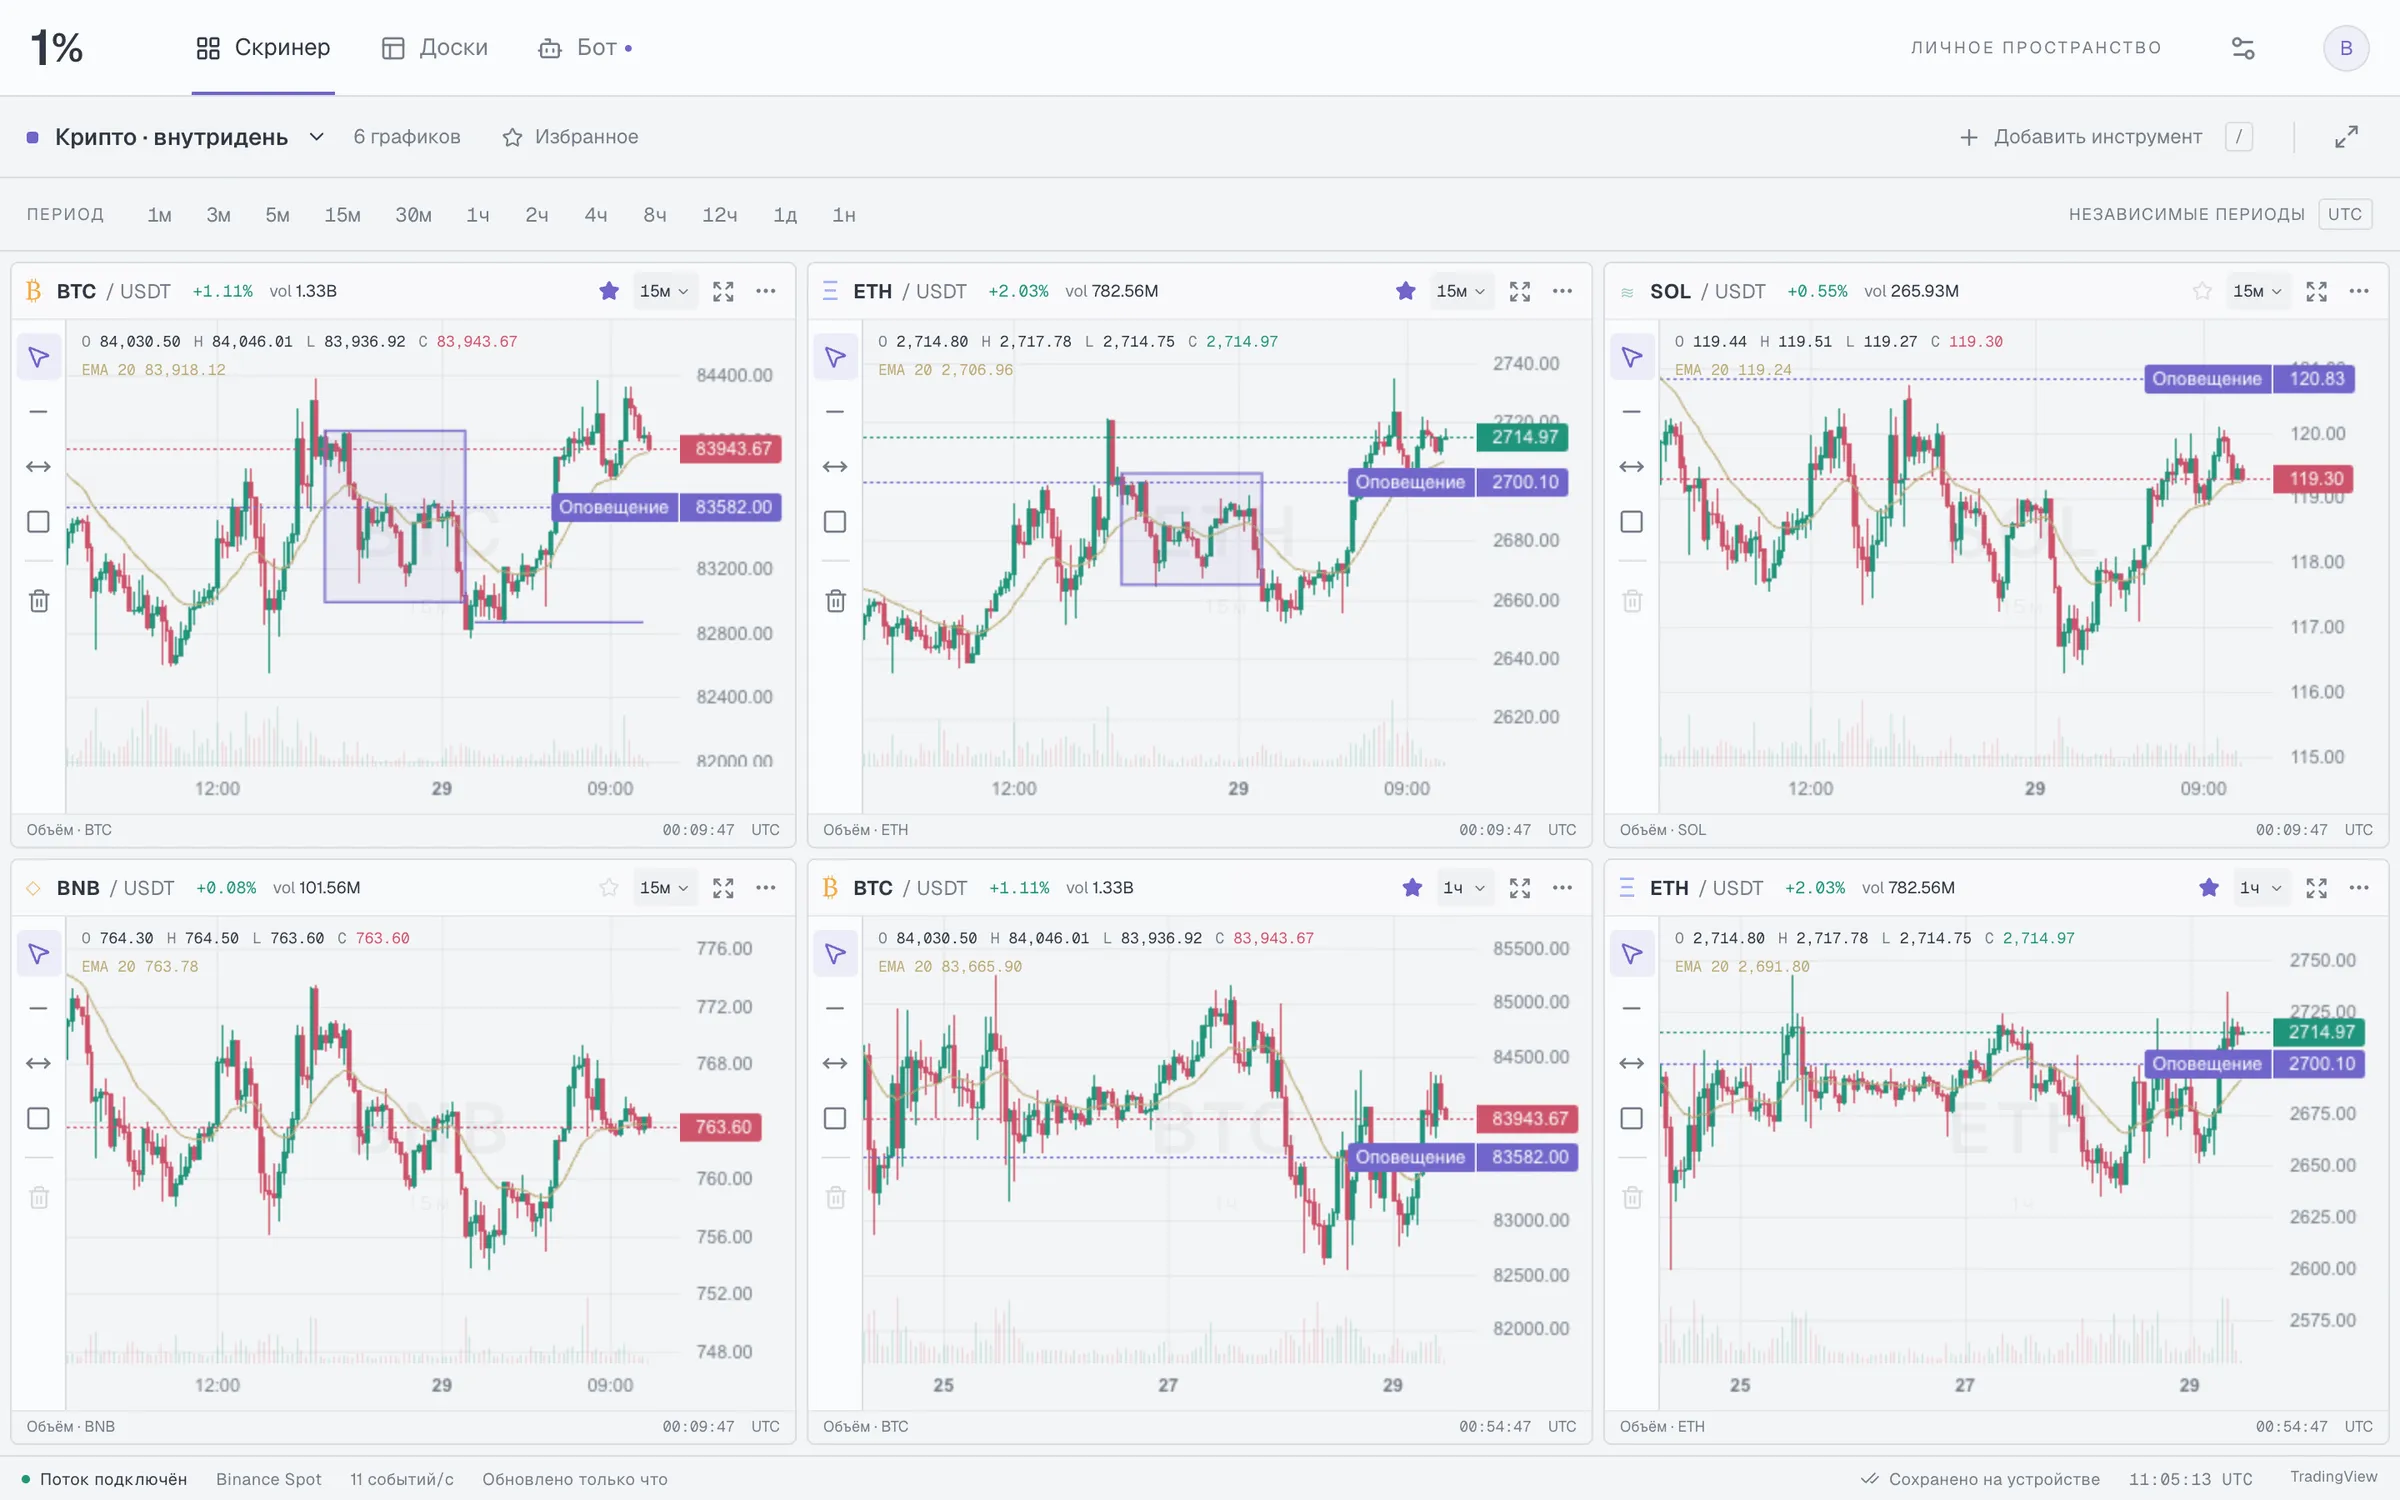
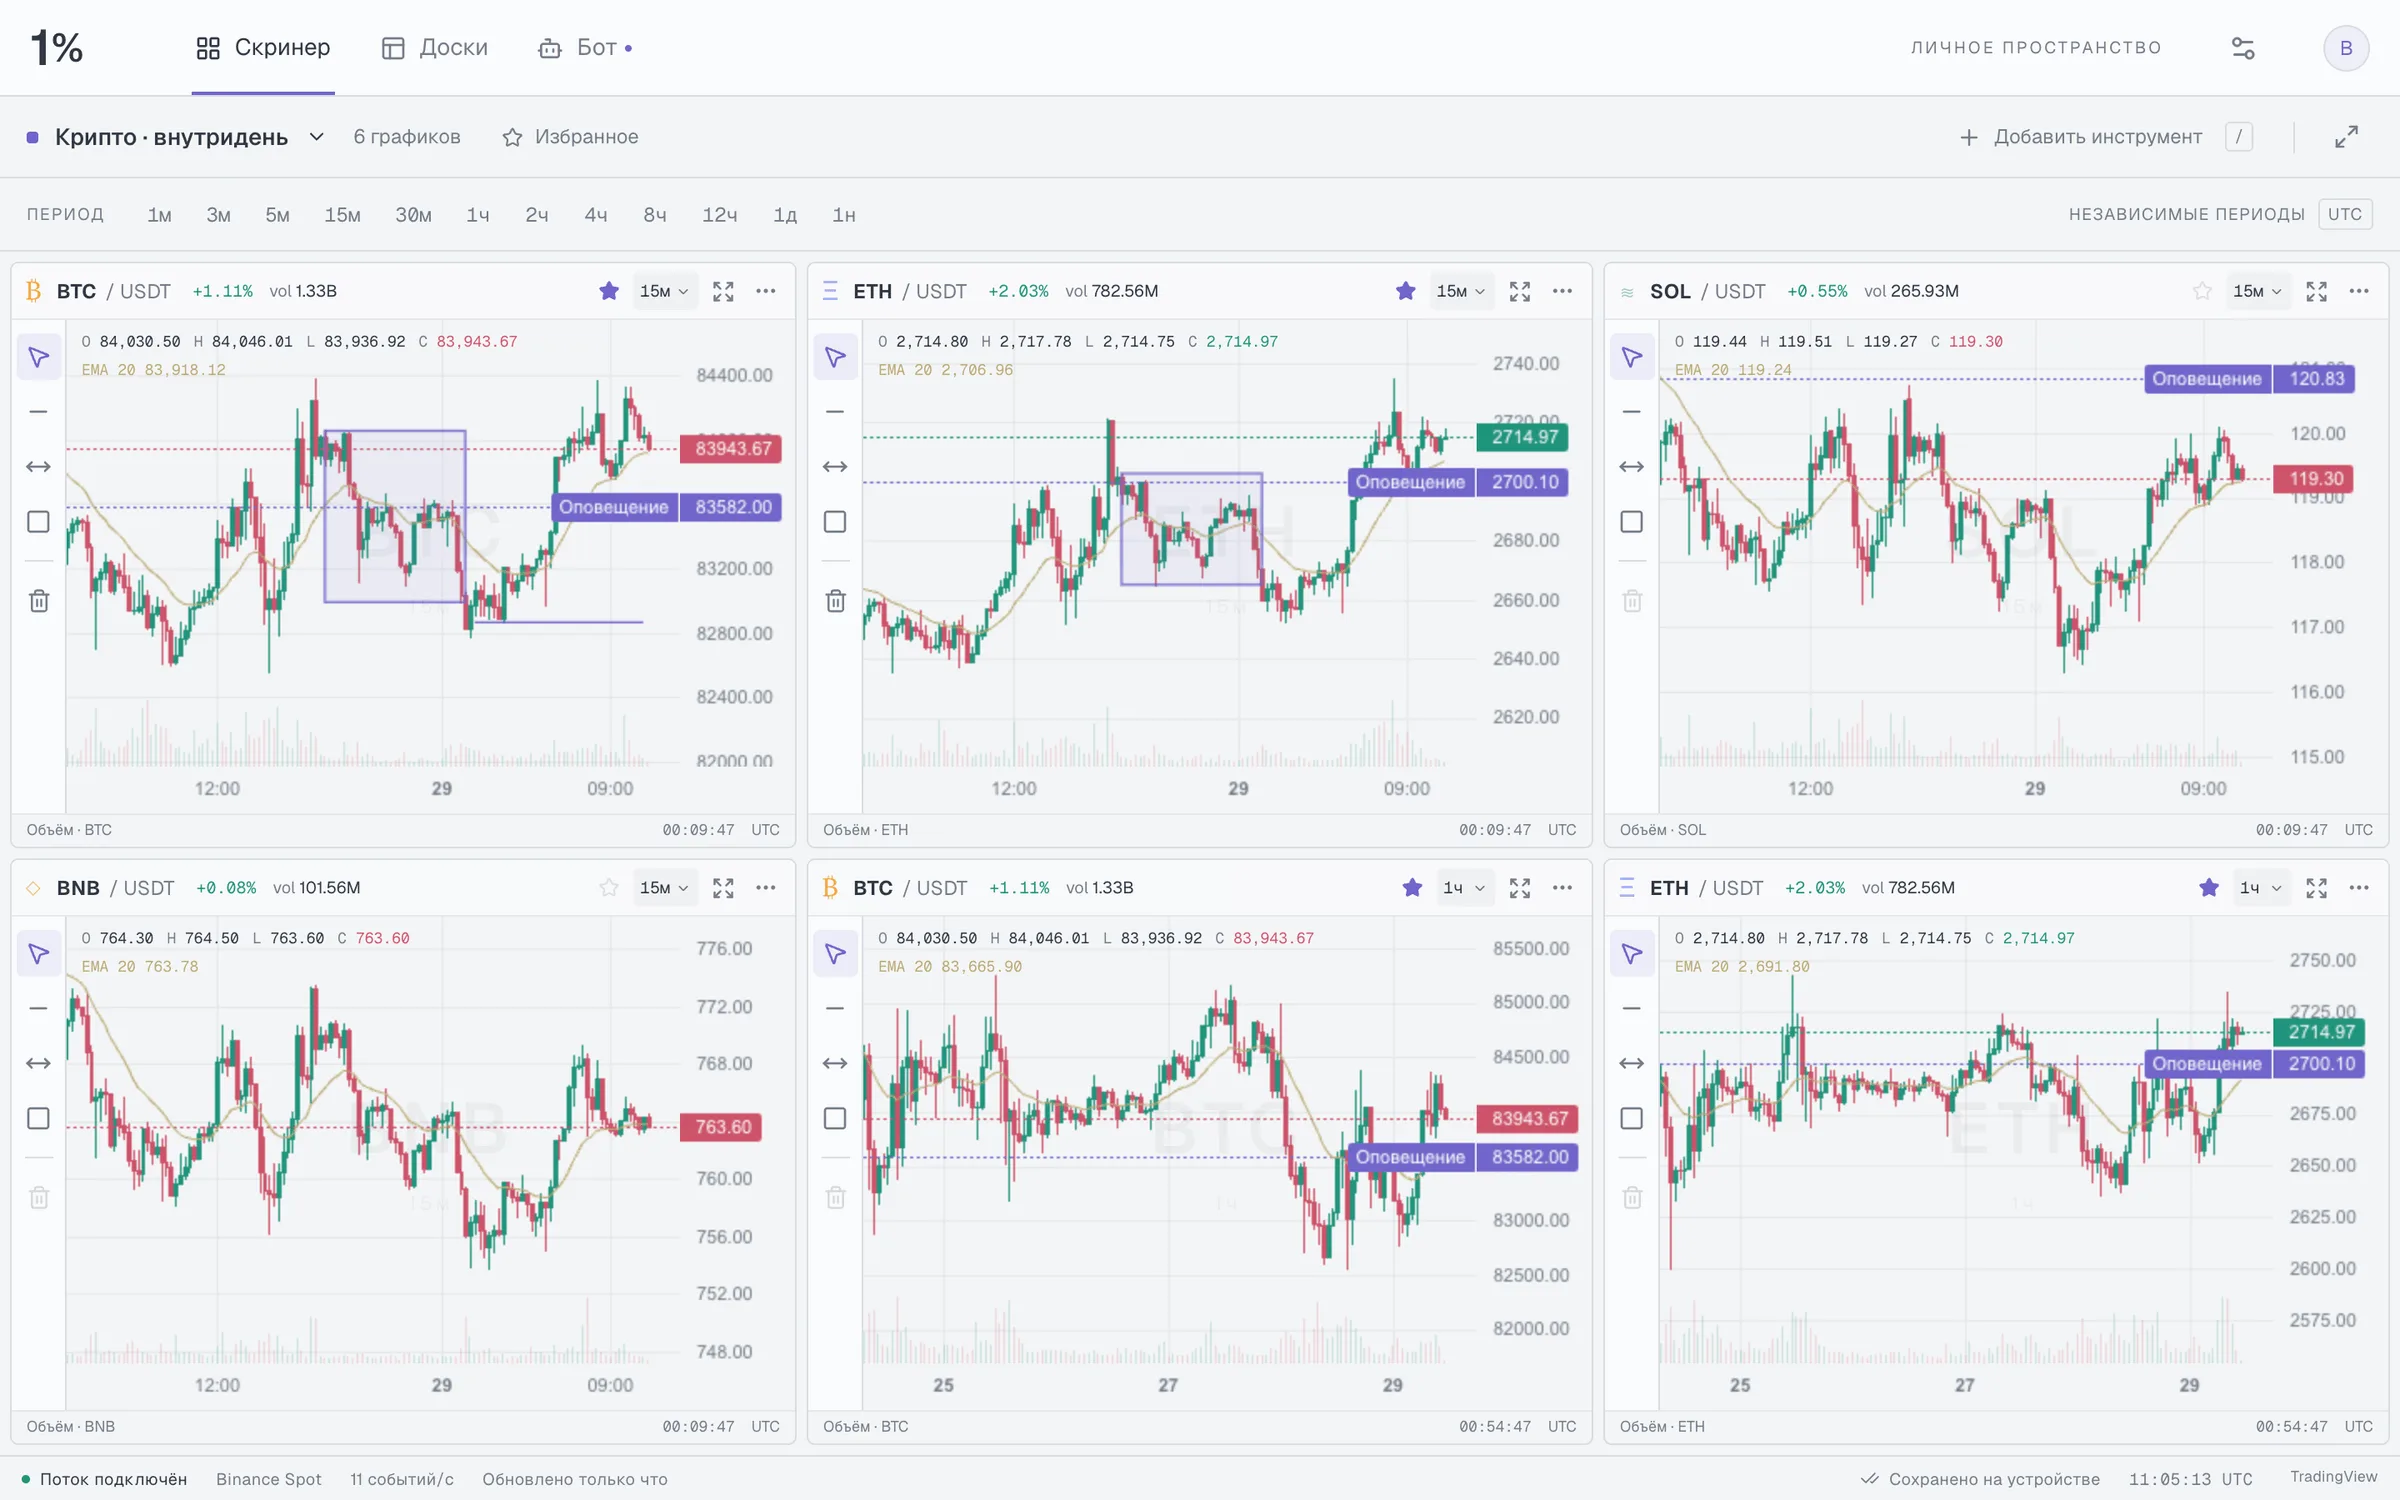
Fig. 4.3 The same six-chart board in the light interface with the “Classic” palette, keeping drawings, EMA and alert levels. -
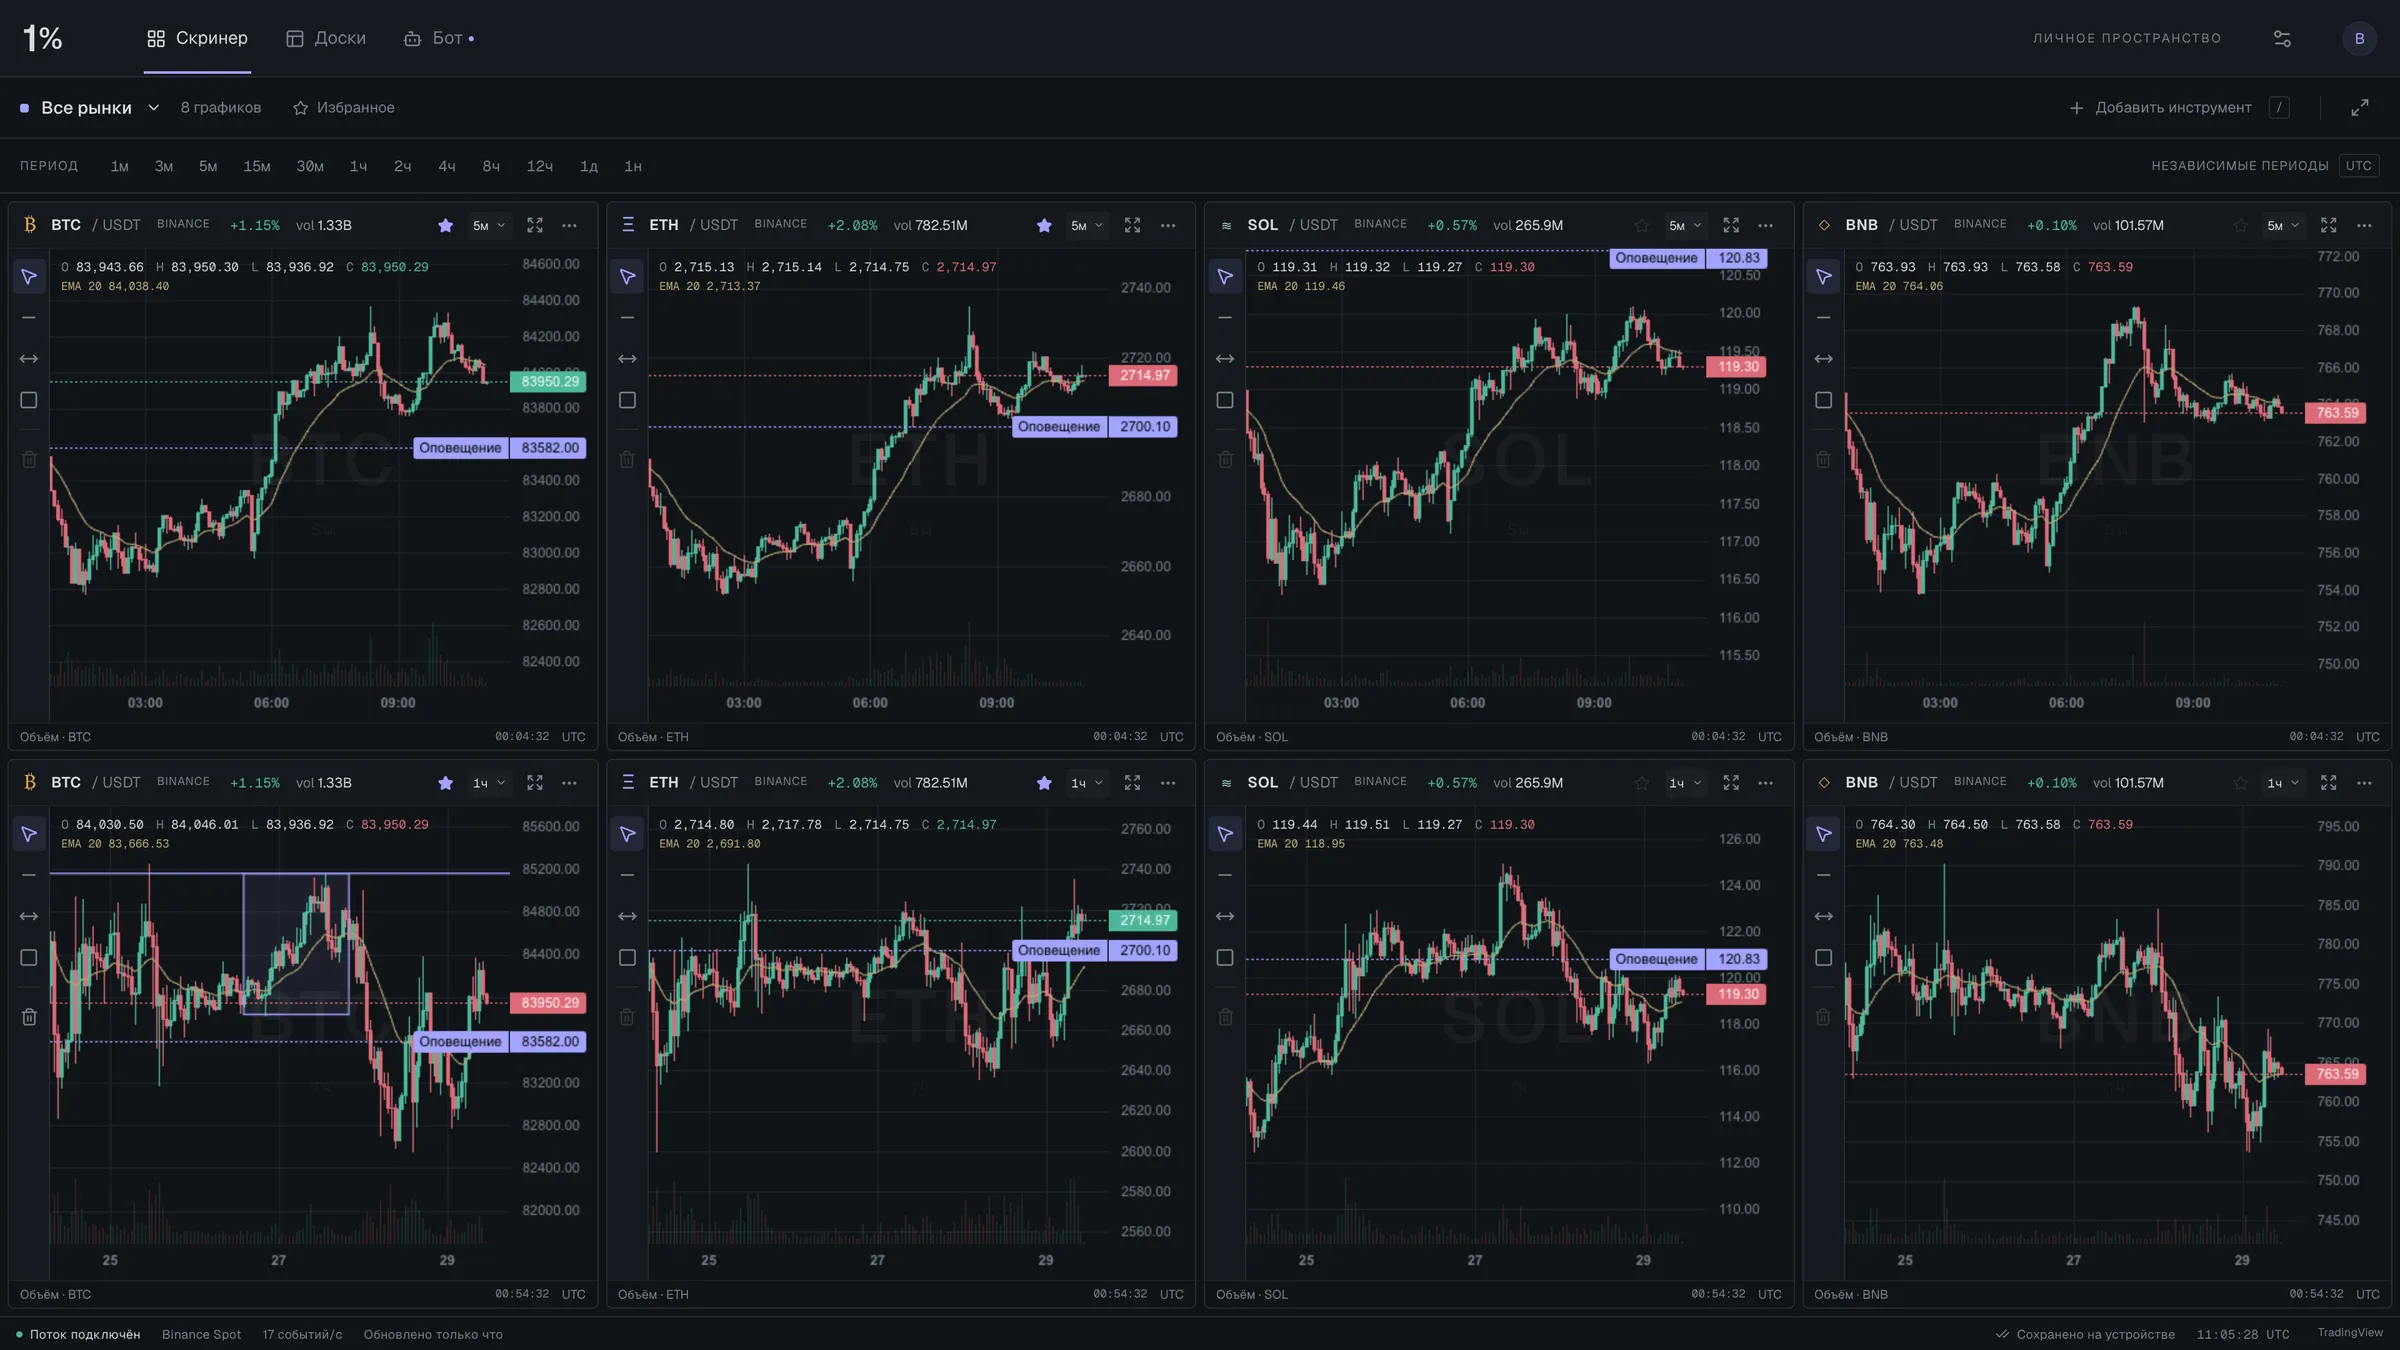
Fig. 4.4 An eight-chart, four-column board at 1920 × 1080 comparing BTC, ETH, SOL and BNB on 5m and 1h side by side.
Details — the mobile screens.
Materials schedule — the stack, and why.
| Layer | Material | Why |
|---|---|---|
| 01Data | Binance Spot WebSocket · history proxy (validated, cached) | Public market data with no API key; the proxy checks symbol and interval before any request leaves the server. |
| 02Logic | Module Web Worker · candle aggregation · trade-ID de-duplication · reconnect epochs | Candles are built off the main thread, so the interface never waits for the stream. |
| 03Intelligence | Minute-impulse monitor · EMA 20 · single-fire alert rules | Fast moves and levels are flagged by rules; nothing is ever traded. |
| 04Interface | React 19 · Lightweight Charts · Canvas · Tailwind 4 | A dense desktop board that stacks into one column on a phone. |
| 05Infra | vinext on Vite · node:test · local by design | A personal tool that runs locally; tests cover worker races, reconnects, EMA and timeframe boundaries. |
Stack
Completion — outcome and links.
Verified facts
- live charts per board
- 12
- Source: source code
- ms batching window for the live stream
- 40
- Source: source code
- twelve timeframes, shared or per chart
- 1m – 1w
- Source: source code
Links
Private
Walkthrough on request
Want to see it running?
I can walk you through the live system on demo data and explain the decisions behind it.
Request a walkthrough